Figures & data
Table 1. Extraction Yield, carbohydrate, and protein contents of sweet lupin polysaccharides
Table 2. Monosaccharide composition of different lupin polysaccharides
Figure 1. SEM images of white (top), yellow (middle) and blue (bottom) lupin polysaccharides
Table 3. Decomposition patterns of lupin polysaccharides
Figure 2. FT-IR spectrum of white lupin polysaccharides. Relevant vibrational peaks in the spectrum are represented with numbers 1 to 11 (Peak 1: 797 cm−1; Peak 2: 837 cm−1; Peak 3: 881 cm−1; Peak 4: 919 cm−1; Peak 5: 1021 cm−1; Peak 6: 1048 cm−1; Peak 7: 1078 cm−1 Peak 8: 1533 cm−1; Peak 9: 1626 cm−1; Peak 10: 2928 cm−1 and Peak 11: 3274 cm−1)
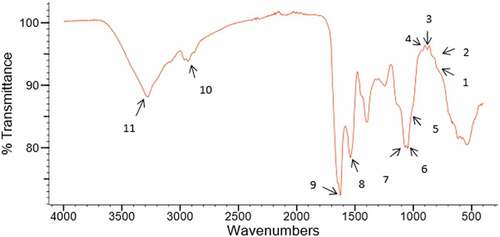
Table 4. Antioxidant activities of polysaccharides from white, yellow, and blue lupins
Figure 3. Dose-dependent scavenging activities of the yellow, white, and blue lupin polysaccharides (ABTS•+ radical scavenging activities are expressed in percentage with respect to the scavenging ability of Vitamin C at 0.25 mg/mL taken as 100%) (n = 3, p < 0.04)
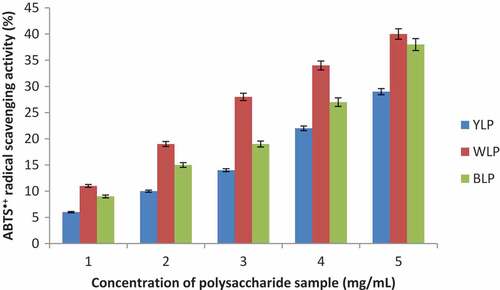
Figure 4. Dose-dependent activities of the yellow, white, and blue lupin polysaccharides (Hydroxyl radical scavenging activities are expressed in percentage with respect to the scavenging ability of Vitamin C at a concentration of 0.532 mg/mL taken as 100%) (n = 3, p < 0.03)
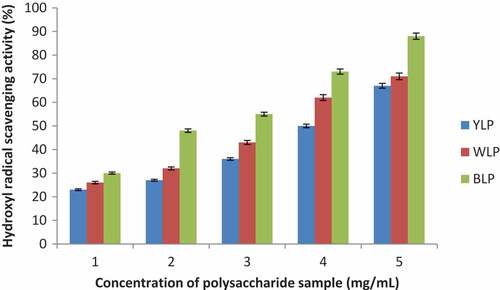
Figure 5. Dose-dependent activities of the yellow, white, and blue lupin polysaccharides (Ferrous chelating activities are expressed in percentage with respect to the chelating ability of EDTA at a concentration of 0.562 mg/mL taken as 100%) (n = 3, p < 0.04)
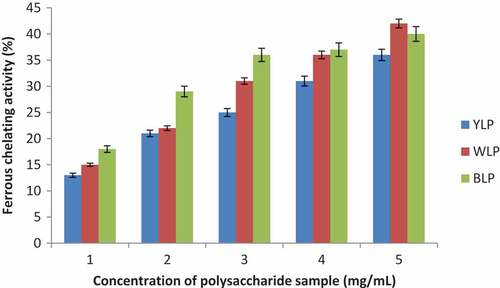
Figure 6. Effect of YLP, WLP, and BLP on macrophage cells for TNF-α production (n = 3, p < 0.05)
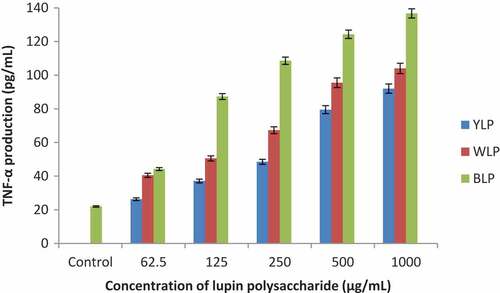
Figure 7. Effect of YLP, WLP, and BLP on macrophage cells for NO production (n = 3, p < 0.04)
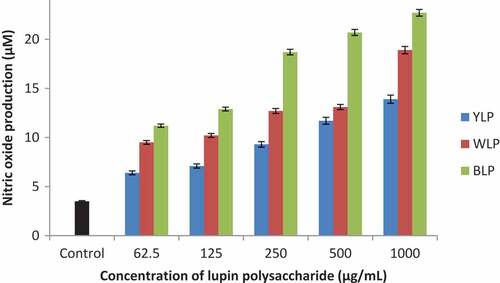
Figure 8. Cell viabilities of yellow, white, and blue lupin polysaccharides (n = 3, p < 0.05)
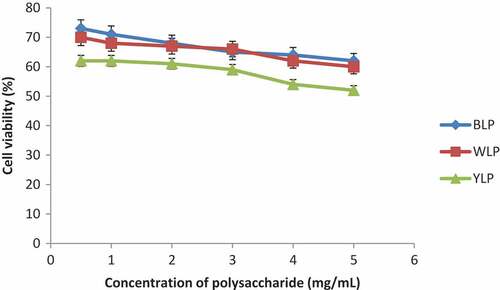
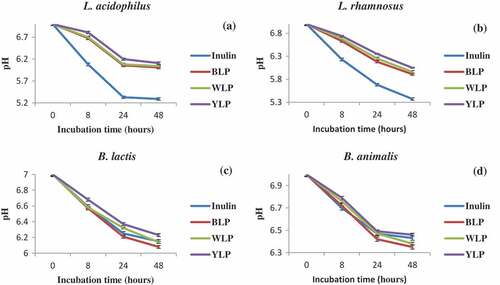
Figure 9. Prebiotic activities of BLP, WLP, and YLP (n = 3, p < 0.04). Positive control was inulin