Figures & data
Table 1. Information of mushroom samples
Figure 1. Geographical origins of Boletaceae mushrooms
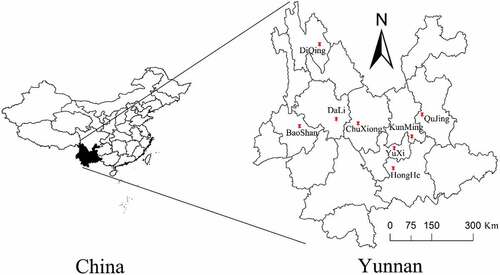
Figure 2. Spectra of Boletaceae mushrooms:
(a) raw FT-IR spectra, (b) raw UV spectra, (c) preprocessed FT-IR spectra, and (d) preprocessed UV spectra.
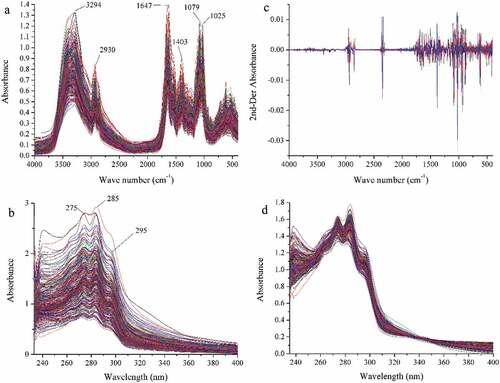
Table 2. The results of mineral concentrations determined in eight origins mushrooms. (mean ± SD, mg kg−1)
Figure 3. Cr concentration of Boletaceae mushrooms from different locations
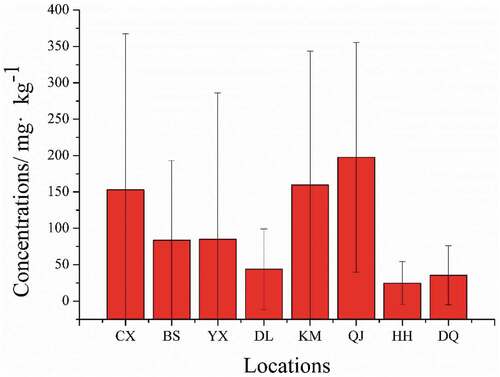
Figure 4. The eigenvalues and contribution rate of first several principal components:
(a) FT-IR spectra, (b) UV spectra, and (c) ICP-AES.
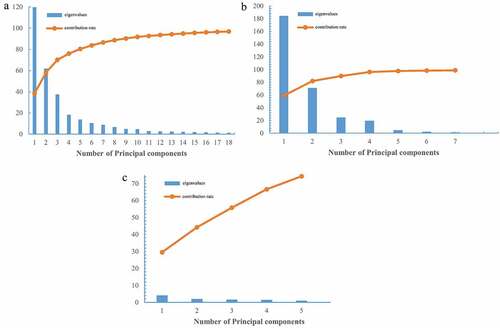
Table 3. The results of SVM models on different data sources
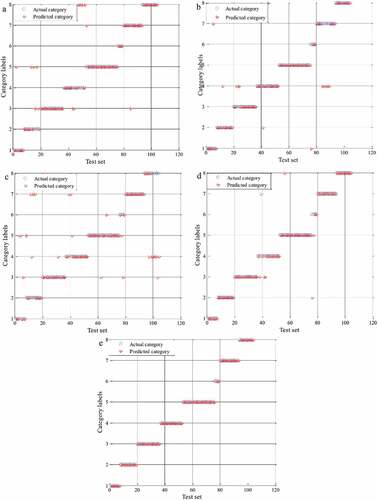
Figure 5. The plot of actual and predicted category of test samples by SVM:
(a) FT-IR spectra; (b) UV spectra; (c) ICP-AES; (d) data fusion of FT-IR and UV; and (e) data fusion of FT-IR, UV, and ICP-AES.