
Figures & data
Figure 1. (A) Representative traces from agglutination of PHA to rabbit erythrocyte cell suspension. (B) Standard curve of agglutination of PHA to rabbit erythrocyte cell suspension
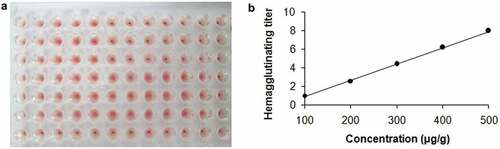
Figure 2. (A) Major fresh kidney bean cultivars in China. (B) Various parts of fresh kidney bean. (C) Different harvest maturity of fresh kidney bean. (D) Different cooking methods of fresh kidney bean
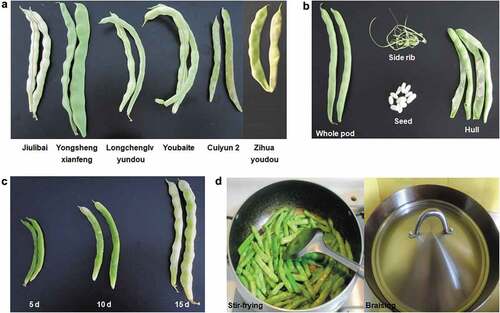
Table 1. Distributions of PHA in various parts of fresh kidney bean
Table 2. PHA contents of Zihuayoudou treated by different cooking method