
Figures & data
Table 1. Proximate analysis of different maize varieties
Table 2. Near-infrared spectroscopy
Table 3. Mineral contents in corn flour
Table 4. RVA parameters are the mean of three values
Figure 1. RVA curves of maize varieties
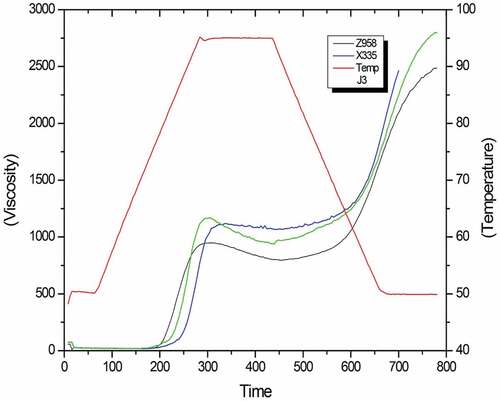
Figure 2. SEM photomicrographs of different corn varieties: A/a xianyu 335; B/b zhengdan 958; C/c jade 3. Micromorphology images of each sample were captured at the magnification of x1000 (upper row) and x5000 (lower row) respectively
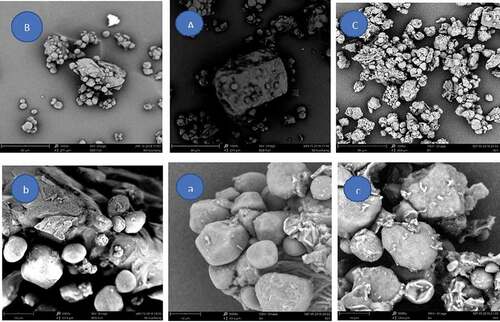
Table 5. Textural properties of different varieties of corn flour
Figure 3. A.and 3B FTIR spectra of corn flour
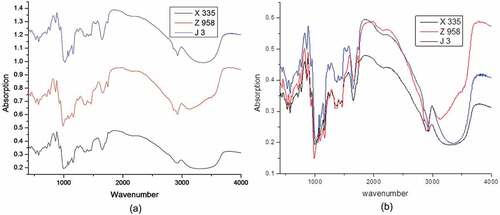
Figure 4. a) Storage modulus [G’], b) Loss modulus [G’’] and c) Tan delta of corn flour
![Figure 4. a) Storage modulus [G’], b) Loss modulus [G’’] and c) Tan delta of corn flour](/cms/asset/c2a5d2df-e971-4570-9564-5519f9dd3b74/ljfp_a_1596124_f0004_oc.jpg)