Figures & data
Figure 1. Flow chart of the separation and isolation of the antioxidant, α-glucosidase inhibitor, and glycation inhibitor from Robusta coffee brew. The separation and isolation were conducted in triplicate (n =3). The concentration of the coffee brew, coffee fractions, and single compounds were equivalent with 5 g ground coffee/100 mL coffee brew (5 g eq./100 mL). P.1.1-P.1.8*: P.1.1, P.1.2, P.1.4, P.1.5, P.1.7, and P.1.8 were the peak groups separated from the water fraction. P.2.1-P.2.12**: P.2.1, P.2.2, P.2.3, P.2.4, P.2.6, P.2.8, P.2.9, P.2.10, P.2.11, and P.2.12 were the peak groups separated from the 20% MeOH fraction
Figure 2. Different activities of coffee brew fractions separated in the ODS Sep-Pak as determined by the DPPH assay (a), H-ORAC assay (b), and anti-α-glucosidase assay (c). The concentration of coffee fractions was 5 g eq./100 mL. The values were expressed as the mean ± SD (n= 3). Different superscripts indicate significant differences in the Duncan test (p< .05)
Table 1. Antiglycation activities of the Robusta coffee brew fractions separated in the ODS Sep-Pak
Figure 3. Different activities of the subfractions separated from the water, 20% methanol, and 40% methanol fractions in the HPLC-5C18-MS-II column: DPPH (a), H-ORAC (b), and anti-α-glucosidase (c). The concentrations of coffee subfractions were 5 g eq./100 mL. The values were expressed as the mean ± SD (n =3). Different superscripts indicate significant differences in the Duncan test (p< .05)
Figure 4. HPLC chromatograms of water (a) and 20% MeOH (b) fractions separated in the HPLC-ODS 4 column
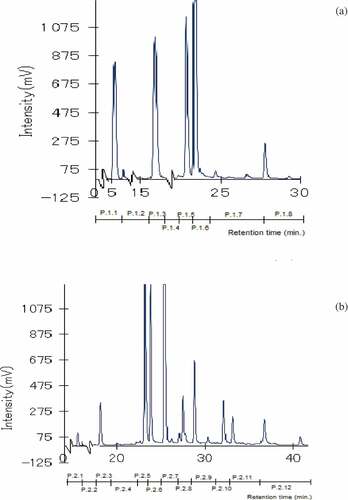
Figure 5. Different activities of peaks and compounds of the water and 20% MeOH fractions separated in the HPLC-ODS 4 column: DPPH (a), H-ORAC (b) and anti-α-glucosidase (c). The concentrations of the peaks or compounds were 5 g eq./100 mL. All values were expressed as the mean ± SD (n = 3). Different superscripts indicate significant differences in the Duncan test (p < .05)
Table 2. LC-MS molecular ion; 13C NMR and 1H NMR (500 MHz, D2O) chemical shifts; and quantitative data of 5-CQA, 4-CQA, and 3-CQA isolated from coffee brew
Figure 6. The chemical structure of 5-O-caffeoylquinic acid (a), 4-O-caffeoylquinic acid (b), and 3-O-caffeoylquinic acid (c)