
Figures & data
Table 1. Characterization of the FPH
Figure 1. Relative molecular weight distributions of the fish protein hydrolysates (FPH) prepared from silver carp on a TSK G3000 PWXL column at 220 nm
Figure 2. Cryoprotective ability of the FPH during freeze-thaw cycles. (a) Salt-soluble protein extractability from freeze-thaw surimi samples added with the FPHs, SuSo, and control. (b) Ca2+-ATPase activity of actomyosin from different surimi samples during freeze-thaw cycles. The reported data are mean values from three replicates. Bars represent standard deviations
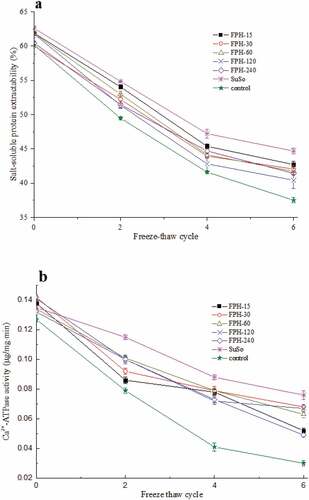
Figure 3. The proportion of unfrozen water determined by DSC from different surimi samples during freeze-thaw cycles. The reported data are mean values from three replicates. Bars represent standard deviations
Figure 4. Relative molecular weight distributions of the fractions obtained by membrane separation from FPH-30 on a TSK G3000 PWXL column at 220 nm
Figure 5. Cryoprotective ability of the fractions obtained by membrane separation from FPH-30 during freeze-thaw cycles. (a) Salt-soluble protein extractability from freeze-thaw surimi samples added with separated fractions and SuSo; (b) Ca2+-ATPase activity of actomyosin from different surimi samples during freeze-thaw cycles. The reported data are mean values from three replicates. Bars represent standard deviations
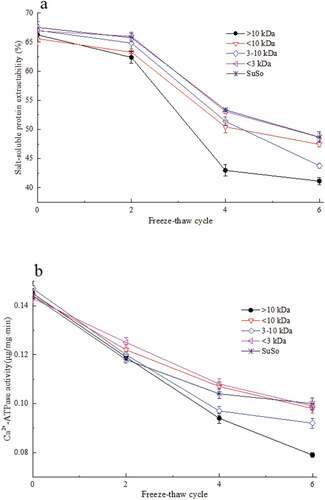
Table 2. The amino acid sequences of the identified peptides and content in four membranes separated fractions