
Figures & data
Figure 1. ATP and related endogenous degradation products of PYAM during iced storage
(A) The content of ATP, ADP, and IMP; (B) the content of AMP, Hx and Hxr. Data point is the mean of n = 3 for each sampling day. Bars represent the standard deviation. Different letters indicated significant differences from each other (p < .05).
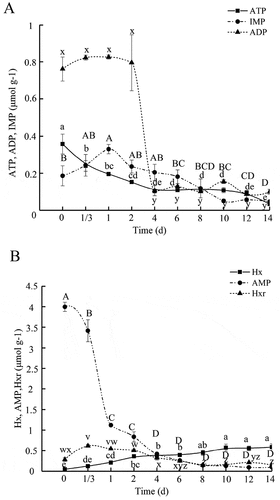
Figure 2. Changes of K value in PYAM during iced storage
Data point is the mean of n = 3 for each sampling day. Bars represent the standard deviation. Different letters indicated significant differences (p< .05).
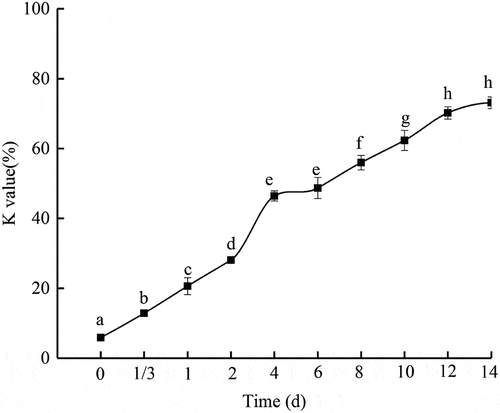
Figure 3. Changes of water-holding capacity (WHC), TVB-N and pH in PYAM during iced storage
Data point is the mean of n = 3 for each sampling day. Bars represent the standard deviation. Different letters indicated significant differences (p < .05).
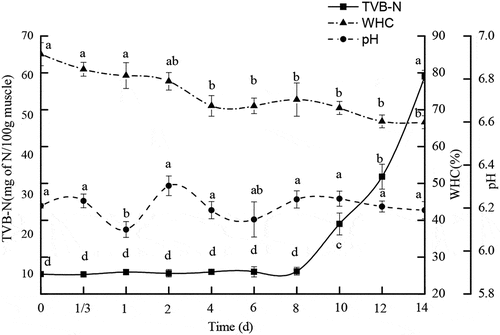
Table 1. Changes of the hardness, chewiness, springiness, adhensiveness, shear force in PYAM during storage in ice
Table 2. Changes in color parameters in PYAM during storage in ice
Figure 4. SDS-PAGE photographs of protein degradation in PYAM during iced storage
20 μg of each sample was loaded in 8% (w/v) SDS-PAGE gel. HM, High molecular Mark; LM, Low molecular Mark
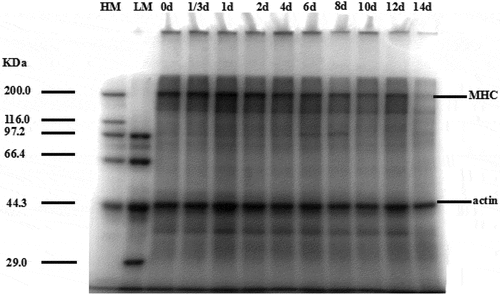
Table 3. Cathepsin activities changes of PYAM during storage in ice