Figures & data
Figure 1. Schematic diagram of transmission spectrum image acquisition device, 1: Computer, 2: USB line, 3: High spectrometer, 4: CCD camera, 5: Compact black box, 6: Egg, 7: Light box, 8: Mobile platform, and 9: Light
Table 1. Sample set of S-ovalbumin content
Figure 2. The regularity of S-ovalbumin content change with day
Table 2. Modelling effect of S-ovalbumin protein content in different calibration models
Figure 3. SPA extraction of characteristic wavelengths: (a) changes in RMSE in the model and (b) optimal characteristic wavelength selected by SPA
Table 3. The optimal wavelength combinations based on the SPA method
Table 4. Model effect of S-oval protein content based on characteristic wavelength
Figure 4. Correlation between measured and predicted values of S-ovalbumin content
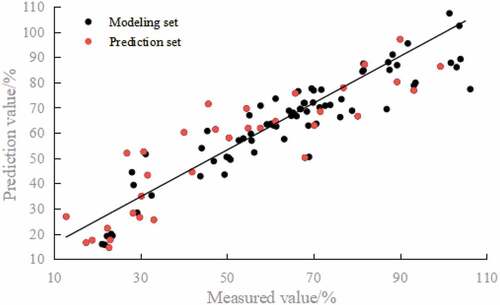
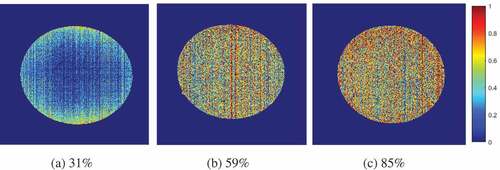
Figure 5. Visualisation of S-ovalbumin content distribution in three egg samples