Figures & data
Figure 1. Slices of shiitake mushrooms, a. Slices of fresh shiitake mushrooms; b. Slices of 50oC hot-air-dried shiitake mushrooms; c. Slices of 60oC hot-air-dried shiitake mushrooms; d. Slices of 70oC hot-air-dried shiitake mushrooms; e. Slices of freeze-dried shiitake mushrooms
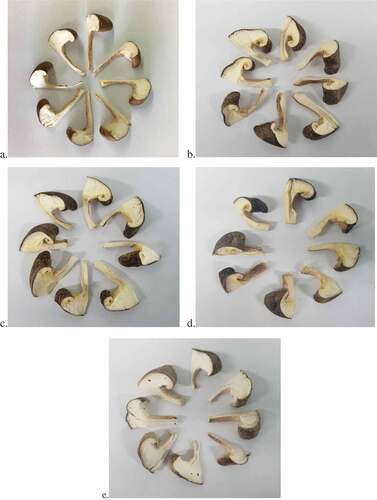
Table 1. The moisture content, browning index, and pH of shiitake mushroom samples
Table 2. Contents of amino acid, organic acid, and nucleotide, EUC in shiitake mushroom samples
Figure 2. The LC spectrogram of (A) amino acids at 440 nm, (B) amino acids at 570 nm (C) organic acids, and (D) 5′-nucleotides for shiitake mushroom samples and standard solution
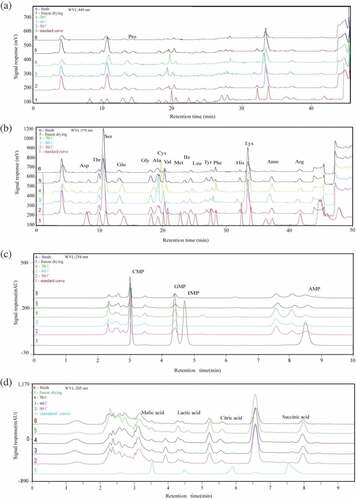
Figure 3. The scanning electron microscope (SEM) micrographs for (A) 50°C hot-air dried shiitake, (B) 60°C hot-air dried shiitake, (C) 70°C hot-air dried shiitake, and (D) freeze-dried shiitake