Figures & data
Table 1. Changes in physicochemical properties of RSF Daqu during aging
Table 2. Summary of sequencing results and the alpha diversity statistical analysis of RSF Daqu samples
Figure 1. Taxonomic classification of sequences from prokaryotic communities of three samples (A, premium-grade Daqu; B, first-grade Daqu; C, general-grade Daqu) at genus level. The relative abundance was calculated by dividing the number of classified tags by the total tags number of each sample. The top 50 genera detected in RSF Daqu are shown. The relative abundance of each genus was indicated by color intensity in a heat map
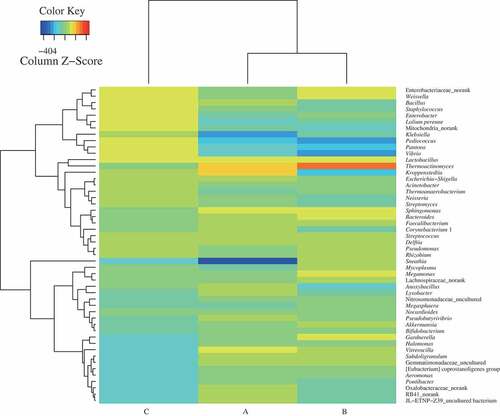
Figure 2. Analysis of prokaryotic community composition in three samples (A, premium-grade Daqu; B, first-grade Daqu; C, general-grade Daqu) using high-throughput sequencing. Results of taxonomy at the phylum level and genus level are shown in (a) and (b), respectively. The relative abundance defines sequence percentages in samples as depicted by the colors in the bar chart. The top 20 phyla and genera detected in RSF Daqu are shown in (a) and (b), respectively. The rest of phyla and genera detected in all samples were classified as others
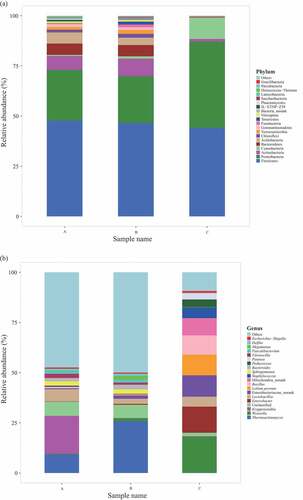
Figure 3. Analysis of eukaryotic community composition in three samples (A, premium-grade Daqu; B, first-grade Daqu; C, general-grade Daqu) using high-throughput sequencing. Results of taxonomy at the phylum level and genus level were shown in (a) and (b), respectively. The relative abundance defines sequence percentages in samples as depicted by colors in the bar chart. The top 20 phyla and genera detected in RSF Daqu are shown in (a) and (b), respectively. The rest of phyla and genera detected in all samples were classified as others
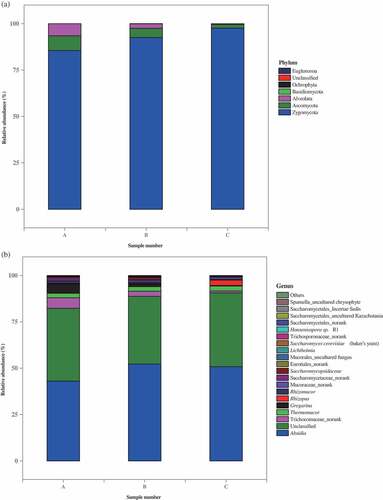
Figure 4. Canonical correspondence analysis (CCA) of prokaryotic communities at genus level and physicochemical properties (a) (DCA = 4.10), and redundancy discriminate analysis (RDA) of eukaryotic communities at genus level and physicochemical properties (b) (DCA = 1.15) found in Daqu. Arrows represent different physicochemical properties; the symbols ■, ●, and▲, represent samples A (premium-grade Daqu), B (first-grade Daqu), and C (general-grade Daqu), respectively
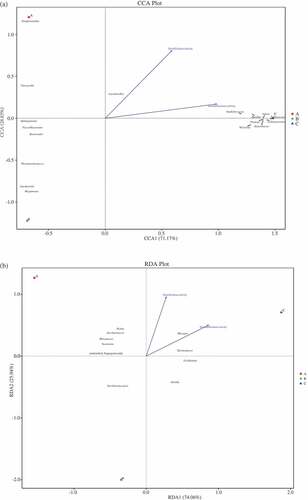
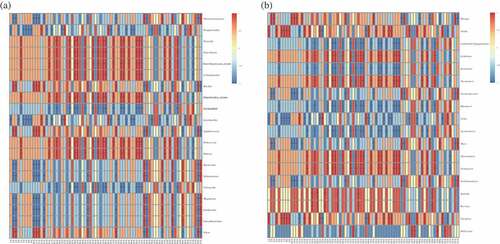
Figure 5. Correlation between volatile compounds (V1-V75: the codes of different flavor compounds in Supplementary Table S2) and prokaryotic communities (a) and eukaryotic communities (b) found in Daqu. Scale bar colors denote the nature of the correlation, with 1 indicating a perfectly positive correlation (read) and −1 indicating a perfectly negative correlation (blue) between them. “*” shows significant correlations (P <0.05), and “NA” shows no correlations