
Figures & data
Figure 1. Changes of Na (A) and K (B) content in dry-cured beef during processing. Salt = dry-cured beef treated with salt; SS = dry-cured beef treated with salt substitute (39.7% of NaCl, 51.3% of KCl and a mixture of 7% L-lysine and 2% L-histidine). Different capital letters (A–D) indicate significant differences among the different times of salt (P < .05), and different lowercase letters (a–c) indicate significant differences among the different times of SS (P <.05). Different capital letters (X, Y) on the same day indicate significant differences among the different treatments (P < .05). Error bars represent the standard deviation of means (n = 3)
Table 1. Changes in physicochemical composition during processing of dry-cured beef using salt and SS treatments
Table 2. Changes in BA concentration during processing of dry-cured beef using salt and SS treatments
Table 3. Changes in free fatty acids during processing of dry-cured beef using salt and SS treatments
Table 4. Changes in lipase activity during processing of dry-cured beef using salt and SS treatments
Figure 2. Changes in TBARS values in dry-cured beef during processing. Salt = dry-cured beef treated with salt; SS = dry-cured beef treated with salt substitute (39.7% of NaCl, 51.3% of KCl and a mixture of 7% L-lysine and 2% L-histidine). Different capital letters (A–D) indicate significant differences among the different times of salt (P < .05), and different lowercase letters (a–e) indicate significant differences among the different times of SS (P <.05). Different capital letters (X, Y) on the same day indicate significant differences among the different treatments (P < .05). Error bars represent the standard deviation of means (n = 3)
Figure 3. Changes of LOX activity in dry-cured beef during processing. Salt = dry-cured beef treated with salt; SS = dry-cured beef treated with salt substitute (39.7% of NaCl, 51.3% of KCl and a mixture of 7% L-lysine and 2% L-histidine). Different capital letters (A–D) indicate significant differences among the different times of salt (P < .05), and different lowercase letters (a–e) indicate significant differences among the different times of SS (P <.05). Different capital letters (X, Y) on the same day indicate significant differences among the different treatments (P < .05). Error bars represent the standard deviation of means (n = 3)
Table 5. Volatile compounds identified in 57-day aged dry-cured beef using salt and SS treatments
Figure 4. Distribution of T2 relaxation times for dry-cured beef during processing. Salt = dry-cured beef treated with salt; SS = dry-cured beef treated with salt substitute (39.7% of NaCl, 51.3% of KCl and a mixture of 7% L-lysine and 2% L-histidine)
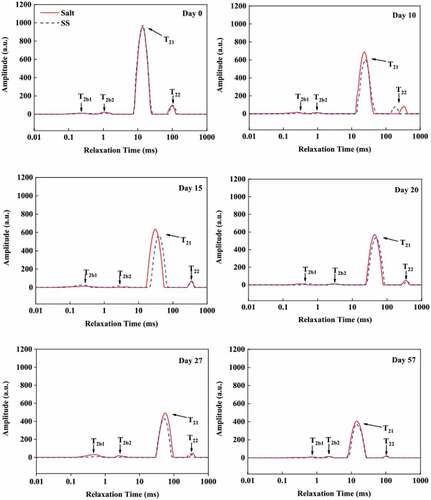
Table 6. Transverse relaxation times (T2) and corresponding relative populations (P2) of dry-cured beef during processing