
Figures & data
Table 1. Comparison of structural properties of decolorized and nondecolorized protein
Figure 1. DSC analysis of DSCP and SCP
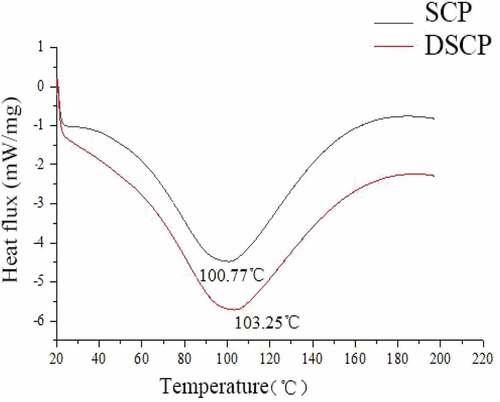
Figure 2. SDS-PAGE of SCP and DSCP (M: Marker; 1: SCP; 2: DSCP)
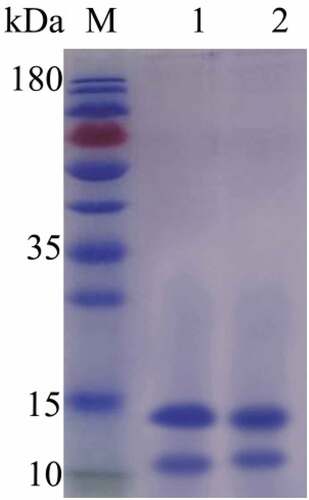
Table 2. Amino acid comosition of SCP (g/100g protein)
Figure 3. IR spectra of SCP and DSCP
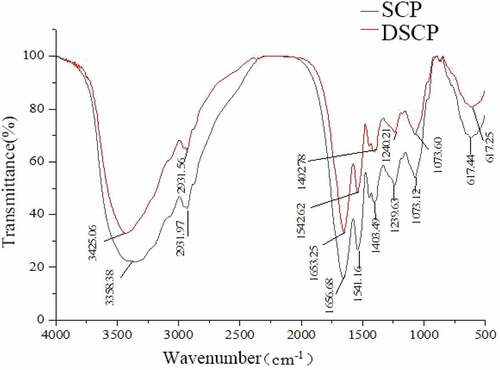
Figure 4. X-ray diffraction patterns of DSCP and SCP
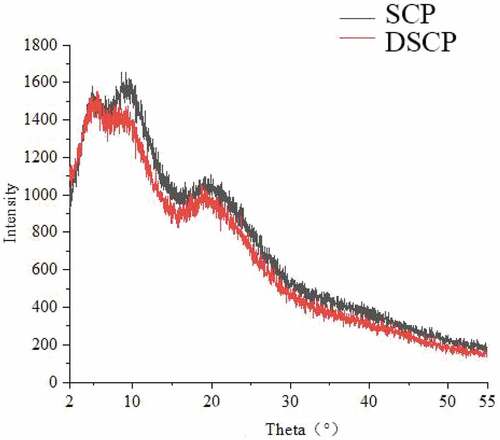
Figure 5. Scanning results of decolorized and nondecolorized proteins detected on electron microscope (1 and2, ×100; 3 and 4, ×5000)
Figure 6. Difference in pH–solubility curve between DSCP and SCP
Table 3. Comparison of functional properties between decolorized and nondecolorized proteins