
Figures & data
Table 1. Factors and levels tested for central composite rotatory experimental design
Table 2. Experimental results and predicted values of the responses for each set of run
Table 3. Estimated coefficients of linear, quadratic, and interaction terms for each response variables, i.e., moisture content (%), solubility (%), yield (g 100 ml−1), and outlet temperature (ºC)
Figure 1. Effect of (a) inlet air temperature and feed flow rate at 10% TS, (b) inlet air temperature and TS (%) at feed flow rate of 5.25 ml/min, and (c) flow rate and TS at inlet temperature of 160ºC on the moisture content
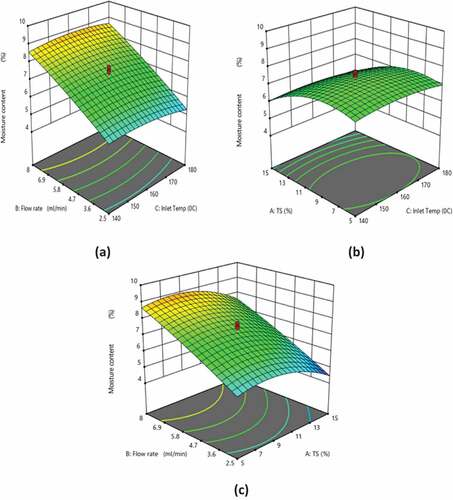
Figure 2. Effect of (a) TS and feed flow rate at inlet air temperature of 160ºC, (b) inlet air temperature and feed flow rate at 10% TS, and (c) inlet temperature and TS at feed flow rate of 5.25 ml/min on the solubility
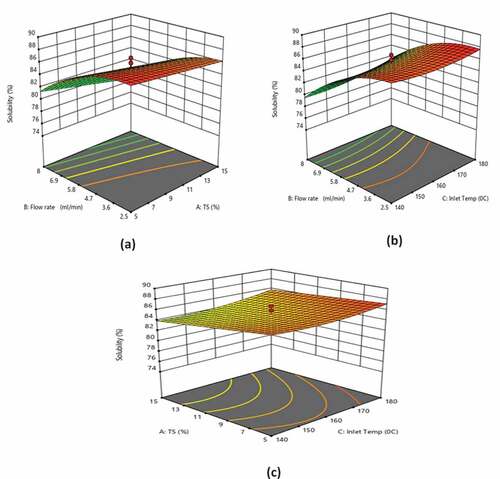
Figure 3. Effect of (a) TS and feed flow rate at inlet air temperature of 160ºC, (b) inlet air temperature and feed flow rate at 10% TS, and (c) inlet air temperature and TS at feed flow rate of 5.25 ml/min on the yield
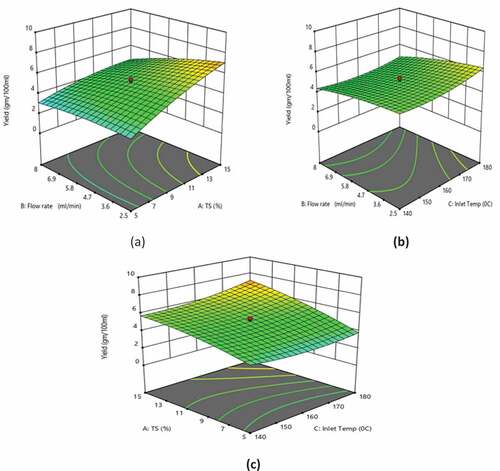
Figure 4. Effect of (a) TS and feed flow rate at inlet air temperature of 160ºC, (b) inlet air temperature and feed flow rate at 10% TS, and (c) inlet temperature and TS at feed flow rate of 5.25 ml/min on the outlet temperature
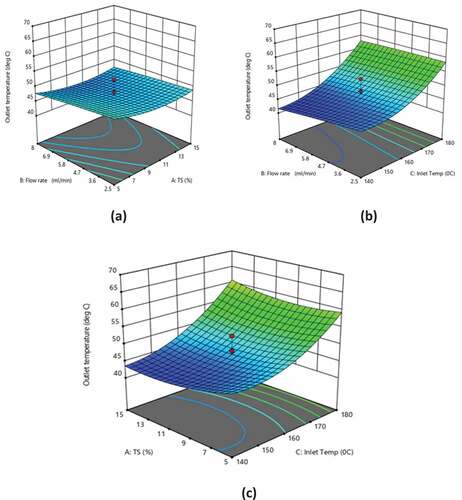
Table 4. Experimental verification of predicted response variables