Figures & data
Figure 1. Exogenously applied H2 not only delayed senescence (a, b), but also slowed down H2 production (c) and nitrate content (d), and nitrite accumulation (e) during storage of tomato fruit. Bar = 5 cm. Asterisk denotes significant difference at P < .05 according to t-test
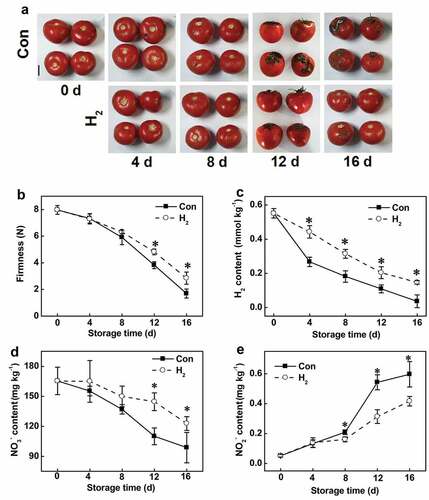
Figure 2. Changes of NR (a) and NiR (b) activities and corresponding transcripts (c and d). Asterisk denotes significant difference at P < .05 according to t-test
Figure 3. Changes of nitrite level (a) and NR activity (b) during storage of tomato fruit for 12 d. Different letters denote significant difference at P < .05 according to Duncan’s multiple tests
Figure 4. Effects of H2 and DCPIP on senescence (a and b), H2 contents (c), and nitrite accumulation (d) during storage of tomato fruit for 12 d. Bar = 5 cm. Different letters denote significant difference at P < .05 according to Duncan’s multiple tests
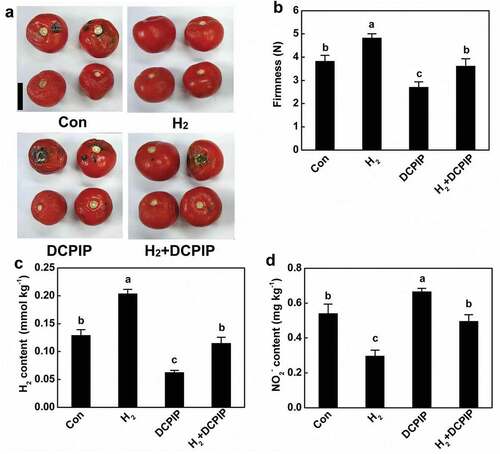
Figure 5. Time-course analysis revealed that the decreases in vitamin C were slowed down by H2 administration. Asterisk denotes significant difference at P < .05 according to t-test
Figure 6. Nitrite accumulation was prevented by vitamin C (Vc) and H2 but increased by exogenously applied sodium nitrite (NO2−) at 25°C and 4°C, during storage of tomato fruit for 12 d. Different letters denote significant difference at P < .05 according to Duncan’s multiple tests