
Figures & data
Table 1. Sensory scheme for evaluating the quality of winter bamboo shoots samples
Figure 1. Schematic diagram of EN system structure
Figure 2. Schematic diagram of stochastic resonance data analysis
Figure 3. Physical/chemical examination results: (a) weight loss; (b) microbial examination; (c) sensory evaluation
Figure 4. EN sensor array original responses: (a) blank sample; (b) non-moldy shoots sample; (c) moldy shoots sample
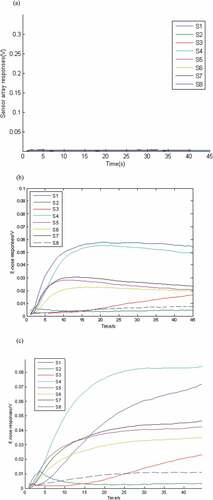
Figure 5. PCA results of bamboo shoots samples stored for 8 days: (a) PCA results of raw EN measurement data; (b) sensor array optimization results; (c) PCA results of optimized EN measurement data
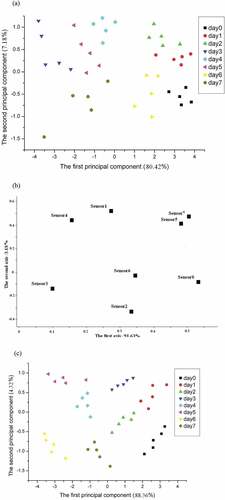
Figure 6. Winter bamboo shoots freshness determination model development: (a) stochastic resonance output SNR curve; (b) Shoots freshness determination model based on linear fitting regression of SNR eigen values
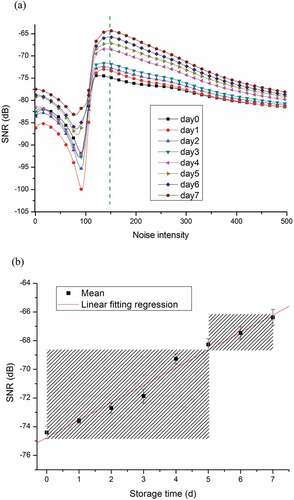
Table 2. Validating experiments results (√ = right; × = wrong; / = not calculated)