Figures & data
Figure 1. Mid-infrared spectra for the 4000–400 cm−1 spectral region recorded on milk samples of Jamnapari (J), Saanen(S) and Toggenburg(T) breeds
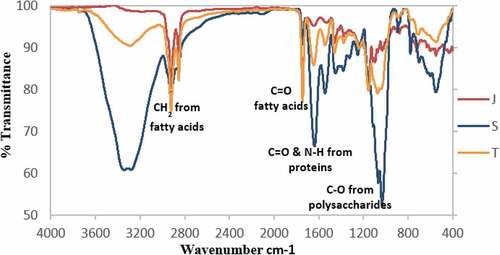
Table 1. The average composition of milk samples from Jamnapari, Saanen and Toggenburg
Figure 2. Partial least square discriminant analysis (PLS-DA)score scatter plot of milk from different goat breeds; Jamnapari (J), Saanen (S) and Toggenburg (T)
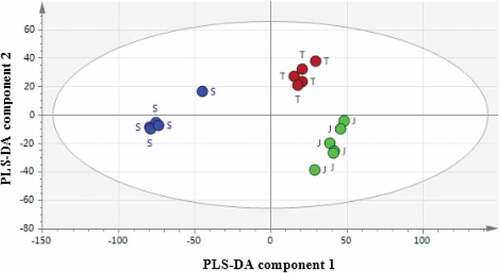
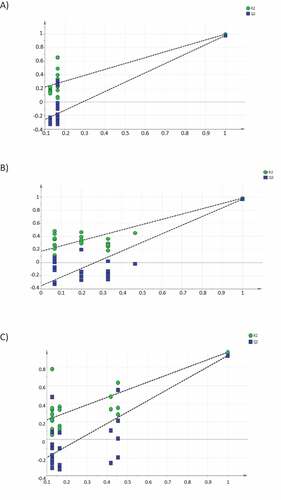
Figure 3. The permutation plot with the R2Yand Q2Y value for: Saanen (A), 0.131 and −0.398; Jamnapari (B), 0.173 and −0.354; Toggenburg (C), 0.133 and −0.326, respectively