Figures & data
Figure 1. (a) Heat maps of the metabolites in 24 h sprouts, 48 h sprouts, and seeds (CK); (b) Heat maps of the metabolites in MeJA-24 h sprouts, MeJA-48 h sprouts, and seeds (CK)
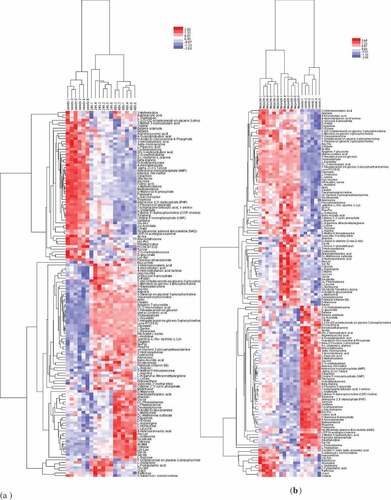
Figure 2. (a) Unsupervised PCA score plot of 24 h, 48 h, and control; (b) Unsupervised PCA score plot of MeJA-24 h, MeJA-48 h, and control
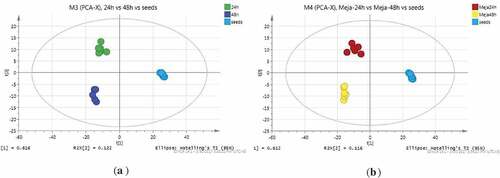
Figure 3. (a) OPLS-DA plots of 24 h and MeJA-24 h sprouts; (b) OPLS-DA plots of 48 h and MeJA-48 h sprouts
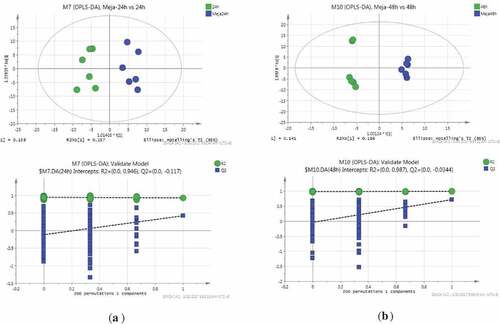
Figure 4. (a) Heat maps of the metabolites in 24 h and MeJA-24 h sprouts; (b) Heat maps of the metabolites in 48 h and MeJA-48h sprouts
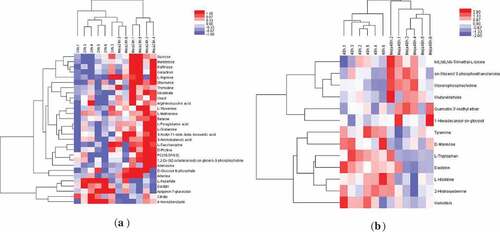
Figure 5. Relative abundance of selected compounds determined in the course of sprouting of rice beans