
Figures & data
Table 1. Basic composition, pH, and water activity of four species of fish
Figure 1. Dielectric properties for four species of fish at frequency range of 1–2500 MHz at 20°C
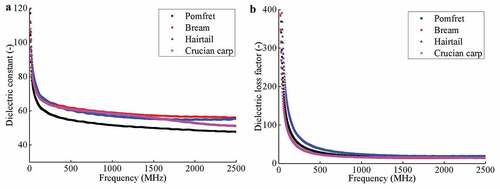
Figure 2. Dielectric properties of Pomfret at frequency 1–2500 MHz and temperature −20–100°C
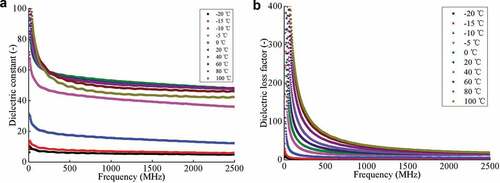
Table 2. Prediction equations for dielectric properties for four species of fish at 20°C as a function of frequency (f, Hz)
Figure 3. Dielectric constant of four species of fish within the temperature range of −20–100°C at 27.12, 40.68, 915, and 2450 MHz, specifically (n=3)
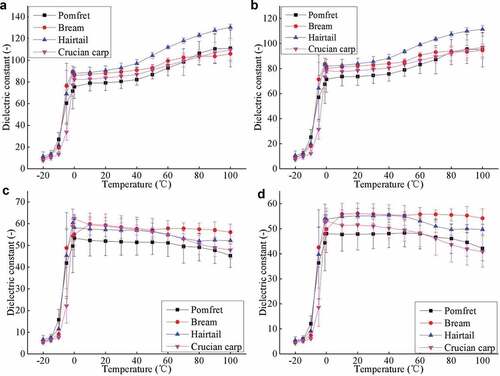
Figure 4. Frequency influence on the dielectric constant of Pomfret at −20°C–100°C (n=3)
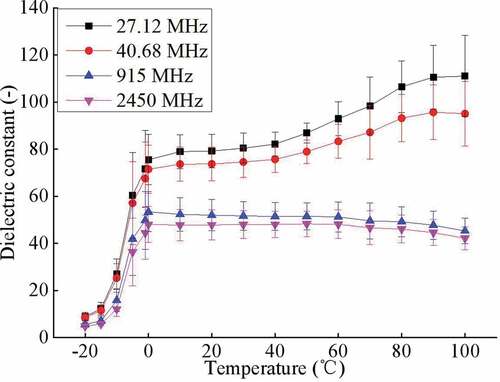
Figure 5. Dielectric loss factor of four species of fish within the temperature range of −20°C–100°C at 27.12, 40.68, 915, and 2450 MHz, specifically (n=3)
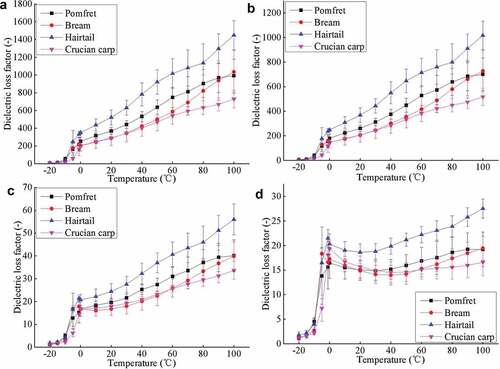
Figure 6. Frequency influence on the dielectric loss factor of Pomfret at −20°C–100°C (n=3)
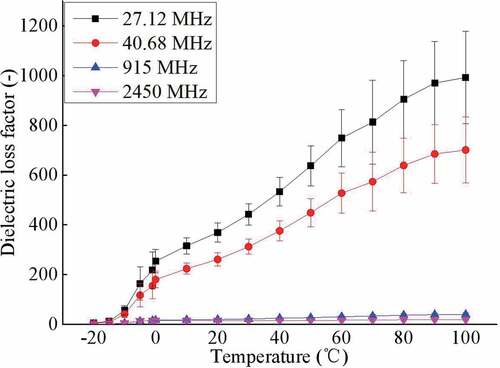
Table 3. Prediction equations for dielectric properties for four species of fish as a function of temperature (T, °C)
Figure 7. Electric conductivity values (from experiment and calculated) for four fishes of different species (n=3)
Table 4. Penetration depth for four species of fish at frequencies between 1 and 2500 MHz and temperatures between −20°C and 100°C