Figures & data
Figure 1. Effect of different cooking temperatures for 40 min on the volumetric changes, length (a), CSA (b) and volume (c) of breast meat blocks of broilers and YFC. Different capital letters (A, B) of the means at the same cooking temperature and different lowercase letters (a-e) at different temperatures are statistically different (p < .05). CSA: Cross-sectional area; YFC: yellow-feathered chicken
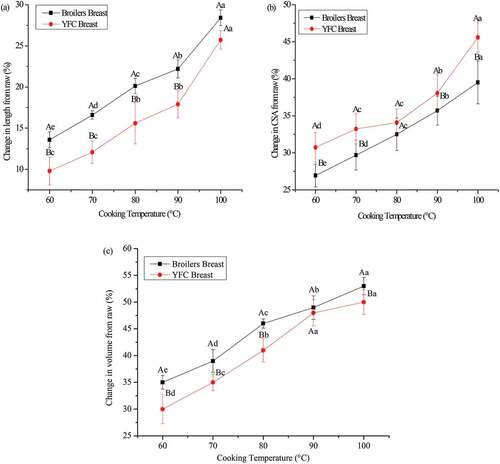
Figure 2. (a) T2 relaxation time distribution curves of chicken breast meat obtained from broilers and YFC subjected to different temperature treatments for 40 min (T21, bound water; T22, immobilized water; T23, free water), (b) Enlarged plot of T21 peak in (a) (green dash-dot rectangle), (c) Enlarged plot of T23 peak in (a) (red dash-dot-dot rectangle). YFC: Yellow-feather chicken
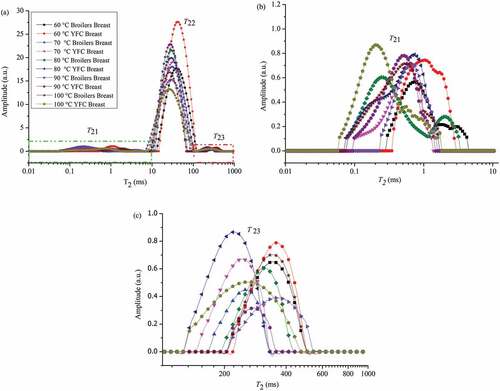
Table 1. Effect of different cooking temperatures on the cooking loss % of breast meat of broilers and YFC Different capital letters (A, B) in columns and different lowercase letters (a-e) in the rows of the means ± SD are statistically different (p< .05). YFC: Yellow-feathered chicken
Table 2. Effect of different cooking temperatures on the pH, expressible moisture and color of breast meat of broilers and YFC
Table 3. Effect of different cooking temperatures on the texture profile of breast meat of broilers and YFC
Figure 3. SDS-PAGE of breast meat subjected to different cooking temperatures for 40 min. (a) Marker. (b) 60°C Broilers. (c) 60°C YFC. (d) 70°C Broilers. (e) 70°C YFC. (f) 80°C Broilers. (g) 80°C YFC. (h) 90°C Broilers. (k) 90°C YFC. (l) 100°C Broilers. (m)100°C YFC. YFC: Yellow-feathered chicken
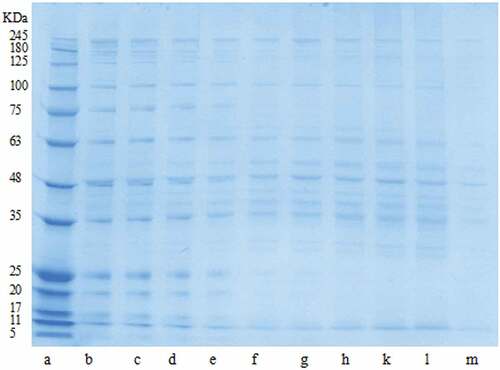
Figure 4. Dynamic viscoelastic rheograms of storage (G′) modulus (a) and loss (G′′) modulus (b) of breast samples obtained from broilers and YFC subjected to cooking at different temperatures for 40 min. YFC: Yellow-feathered chicken
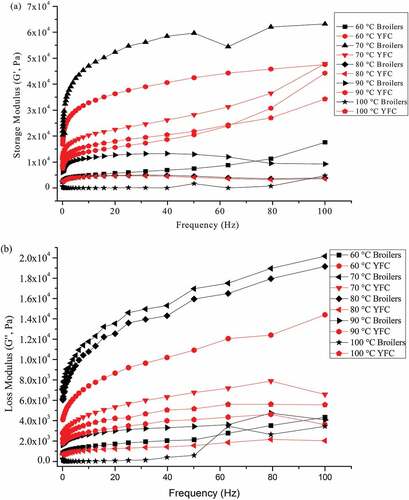
Figure 5. H-proton density images of breast samples obtained from broilers and YFC subjected to cooking at different temperatures for 40 min. YFC: Yellow-feathered chicken
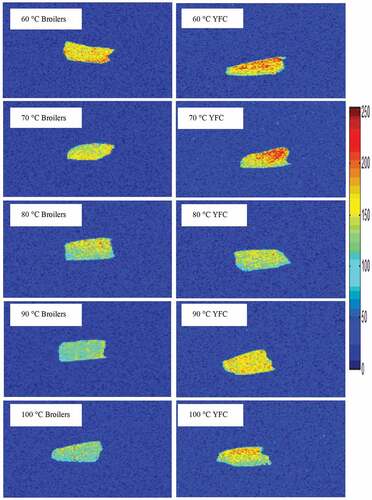
Figure 6. Cross-sections of breast samples obtained from broilers and YFC subjected to cooking at different temperatures for 40 min observed by SEM ×120. YFC: Yellow-feather chicken
Figure 7. An overview of variations found in the mean data from the correlation loading plot (first and second PLS component) of PLSR using meat quality traits as X and dimensional changes (CSA, length, and volume) as Y (a). Correlation loading plot (first and second PLS component) of PLSR using meat quality traits of breast samples as X and different cooking temperatures as Y (b). B: Broilers; YFC: Yellow-feathered chicken; CSA: Cross-sectional area
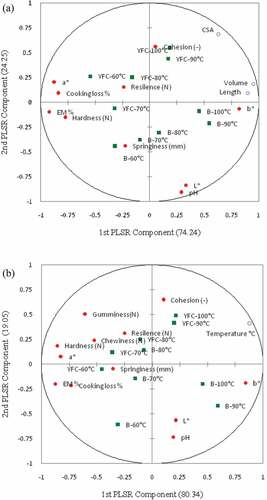
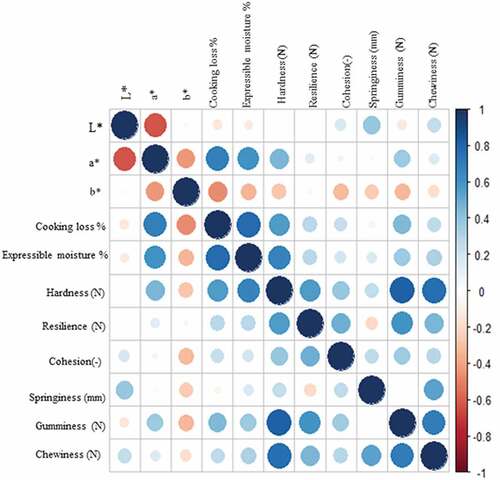
Figure 8. Correlations plot among the measured meat quality traits of breast samples of broilers and YFC subjected to different cooking temperatures. YFC: Yellow-feathered chicken