
Figures & data
Figure 1. Schematic diagram of treatments for both objectives in this study
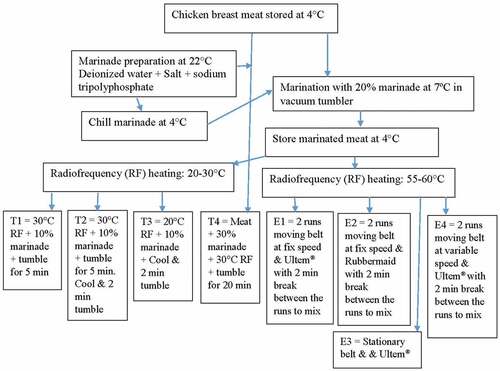
Table 1. Amount of marinade gain and total moisture content of meat for different treatments
Table 2. Effect of various treatments on purge, pH, expressible moisture and cook yields for objective 1 experiments
Table 3. Analysis of variance (ANOVA) table for various parameters measured for different treatments (T1, T2, T3, T4 and the control) for objective 1 experiments
Figure 2. A typical time-temperature profile for pre-heating marinated chicken breast meat in RF oven using Ultem® as a product carrier (n = 9). ♦ temperature measured in a meat piece at the center of tray, ♦ temperature measured in a meat piece at the rear end of the tray. Only a typical curve from the 9 curves is shown
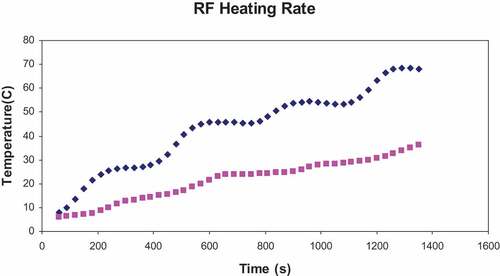
Figure 3. A typical time-temperature profile for pre-heating marinated chicken breast meat in RF oven using Rubbermaid container as product carrier (n = 3). Blue line is for temperature measurement in a meat piece at the bottom layer of the tray and pink line is for a meat piece temperature at the top layer. Only one typical curve out of 3 curves is shown
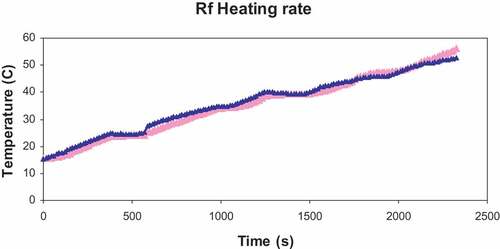
Table 4. Effect of treatments on gain, cook yields, shear and work of shear for objective 2 experiments
Table 5. Analysis of variance (ANOVA) table for various parameters measured for four different treatments and control for objective 2 experiments