Figures & data
Figure 1. Comparison of physicochemical properties in black glutinous rice wine during pre-fermentation
Figure 2. Comparison of enzymatic activities in black glutinous rice wine during pre-fermentation
Figure 3. PCA (A) and OPLS-DA (B) score plots for black glutinous rice wine obtained by GC-TOF-MS
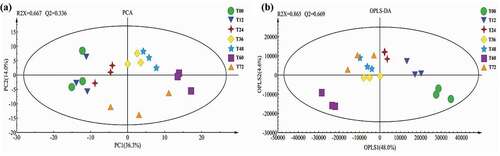
Figure 4. The relative content of SDMs in black glutinous rice wine at different fermentation times. The relative contents are represented as log10-transformed peak areas. Red and green symbolize higher and lower relative content, respectively
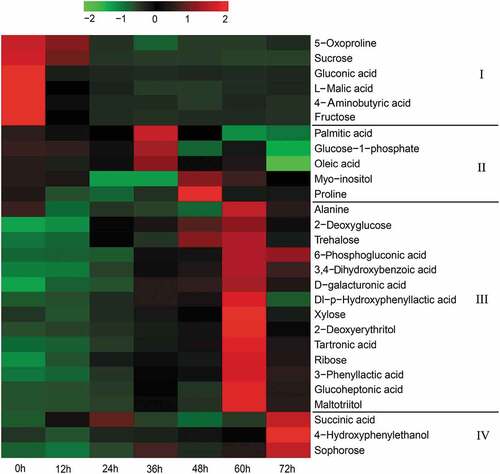
Figure 5. Integrated metabolic pathway of black glutinous rice wine during pre-fermentation. Beneath each metabolite, the color on a white-to-red gradient indicates the fold change with respect to unfermented black glutinous rice, white and red represent the minimum and maximum values, respectively. The SDMs (VIP > 1 and p < .05) screened by the OPLS-DA model are shown in red, and the intermediates are shown in black
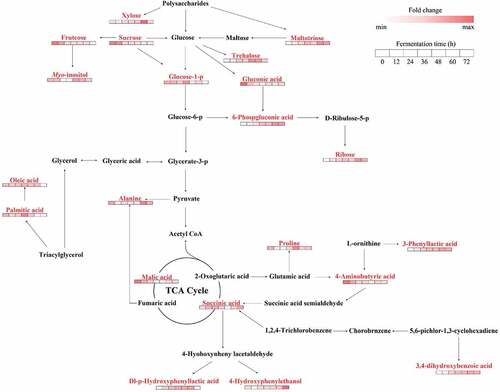
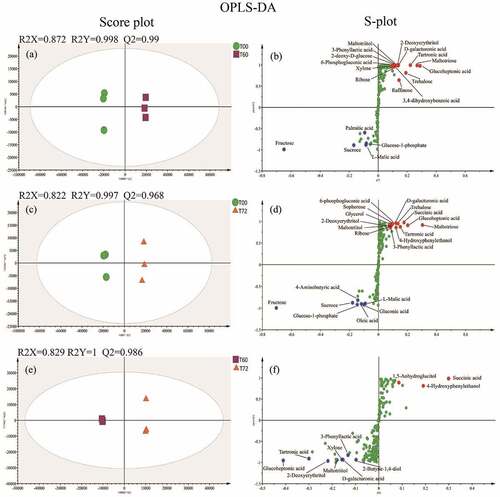
Figure 6. The OPLS-DA score plot (A, C, E) and S-plot (B, D, F) for black glutinous rice wine at 0 h, 60 h, and 72 h of fermentation obtained by GC-TOF-MS. Significantly different metabolites were labeled in the S-plot as blue for downregulated, red for upregulated, and green for no significant change