Figures & data
Table 1. Extract yield, TFC and TPC in different extracts from C. reflexa.
Table 2. DPPH and TAP results for different extracts from C. reflexa extracts.
Table 3. The α-glucosidase and α-amylase inhibition activities for different extracts from C. reflexa.
Figure 1. UHPLC-QTOF-MS/MS chromatogram of 80% HE C. reflexa extract.
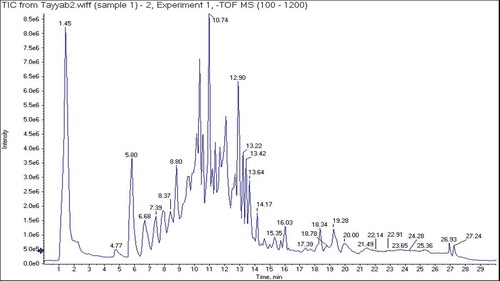
Figure 2. Structures and MS/MS spectra of compounds (1–13) identified in 80% C. reflexa HE extract.
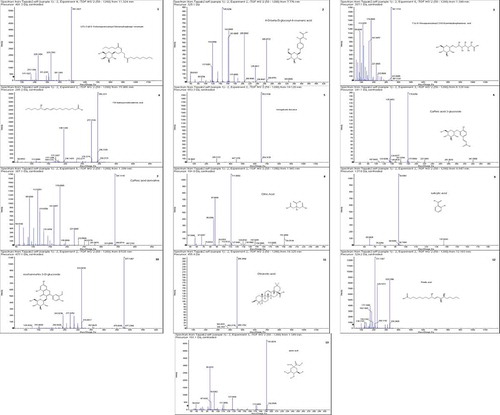
Table 4. Phytoconstituents identified in 80% C. reflexa HE extract by UHPLC-QTOF-MS/MS.
Figure 3. Proposed fragmentation pattern of compounds identified from C. reflexa 80% HE extract.
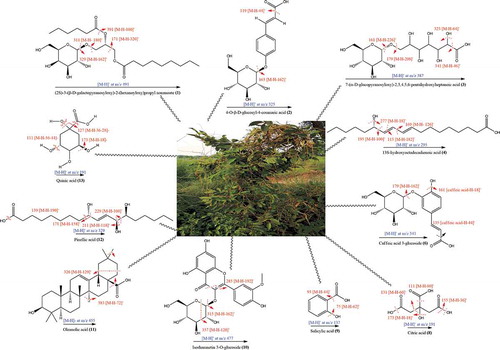
Figure 4. (a). Ribbon diagram for α-glucosidase (homology modeled). The 3 AARs shown as red sphere (Asp349, Glu276 and Asp214) are catalytic triad residues. The possible active sites are indicated in the form of yellow spheres (b) A ribbon diagram indicating eminent residue in stick form (c) 3-D docking pose of standard drug (acarbose) into the active sites of enzyme (d) A ribbon diagram of superposed compounds of current study into the binding sites.
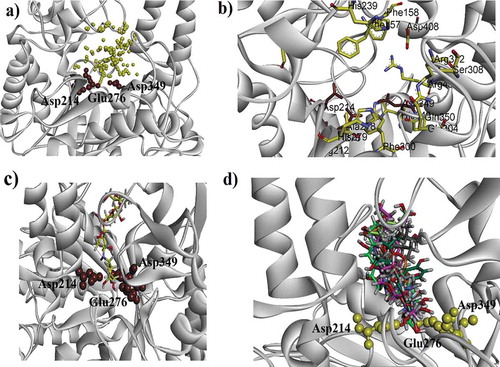
Figure 5. (a–d). The 3-D interaction plot of identified phytochemicals (1–4) into the active sites of α-glucosidase, respectively. Green dotted lines showed hydrogen bonds and purple dotted lines presented π–π stacking interactions. Distances (in Å) of hydrogen bonds are written in blue. While, for π–π stacking interactions it is written in green.
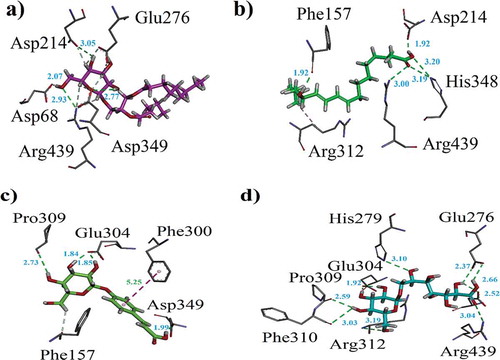
Figure 6. (a–d). The 3-D interaction plot of identified phytochemicals (6, 8, 9–10), respectively, into the active sites of α-glucosidase.
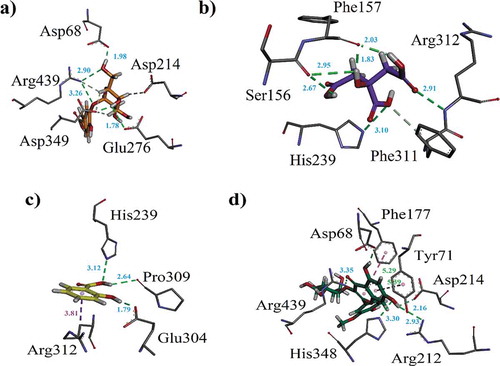
Figure 7. (a–c). The 3-D interaction plot of identified phytochemicals (11–13) into the active sites of α-glucosidase, respectively (d) 3-D interaction plot of acarbose.
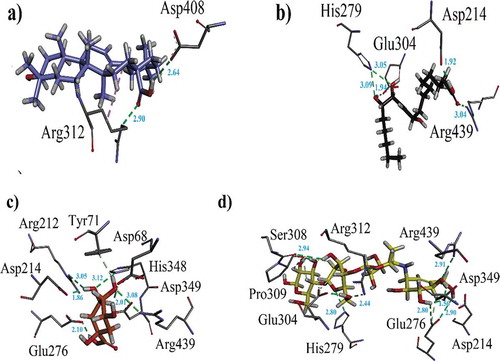
Table 5. Binding affinity values (kcal/mol) and ligand interaction pattern revealed by identified phytoconstituents and acarbose toward yeast α-glucosidase.
Figure 8. (a-k). The 3-D interaction plot for identified phytochemicals (1–4, 6, 8–13), respectively. (l) The 3-D interaction plot of acarbose into active sites of PPA.
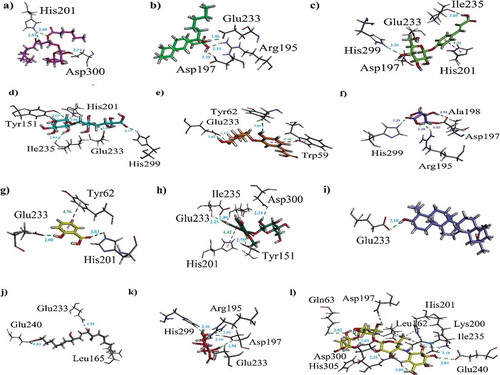
Table 6. Binding affinity values (kcal/mol) and ligand interaction patterns computed for possible isolated phytoconstituents and acarbose toward yeast α-amylase.
Figure 9. The S0 charge-density distribution of FMOs in identified bioactives (contour value = 0.035).
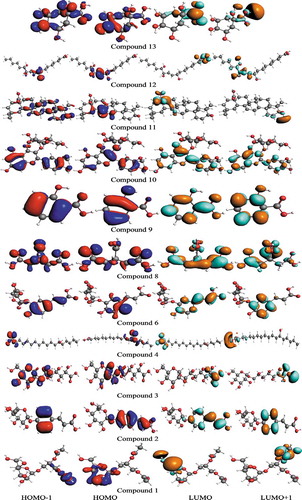
Table 7. The computed ground state HOMO energies (EHOMO, EHOMO-1), LUMO energies (ELUMO, ELUMO+1), HOMO-LUMO-Egaps and IP (-EHOMO) in eV for identified bioactives.
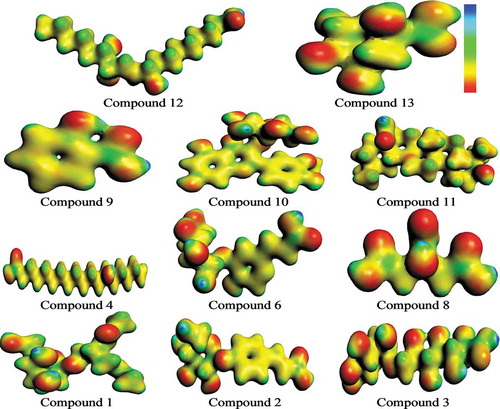
Figure 10. MEP surface views of studied compounds.