Figures & data
Figure 1. Generation of pepper seeds during the processing of pepper products.
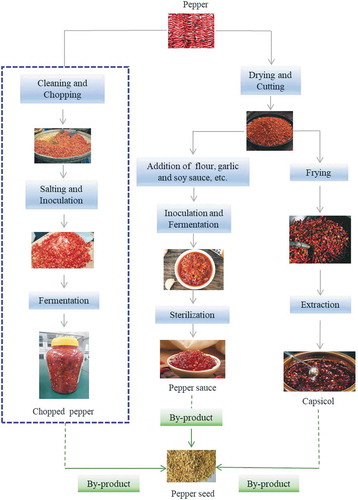
Table 1. Total phenolics content (TPC) of WPS, LPS, and BRPS extracted with various solvents.
Table 2. Capsaicin, dihydrocapsaicin, and nordihydrocapsaicin in terms of total capsaicinoids contents of WPS, LPS, and BRPS extracted with various solvents.
Figure 2. Ferric reducing antioxidant power (FRAP) (a), scavenging effect of DPPH radical (b), ABTS·+ scavenging ability (c) and reducing power (RP) (d) of the various extracts from WPS, LPS, and BRPS. Values were represented as mean ± standard deviation of triplicate assay. Values followed by different superscript capital letters (a–c) are remarkably different (p< .05) among WPS, LPS and BRPS from the same extracted solvent. Values followed by variant superscript small letters (a-c) suggest considerably different (p< .05) among 80% methanol, 80% ethanol, and 80% acetone extracts from the same CPS samples (WPS, LPS, or BRPS).
Figure 3. Inhibitory activity against α-glucosidase of the various extracts from WPS, LPS, and BRPS. Values are means ± standard deviation of triplicate assay. Values with different superscript uppercase letters (a–c) indicated significantly different (p< .05) among WPS, LPS, and BRPS from the same extracted solvent. Values with different superscript lowercase letters (a-c) demonstrated remarkably different (p< .05) among 80% methanol, 80% ethanol, and 80% acetone extracts from the same CPS samples (WPS, LPS, or BRPS).
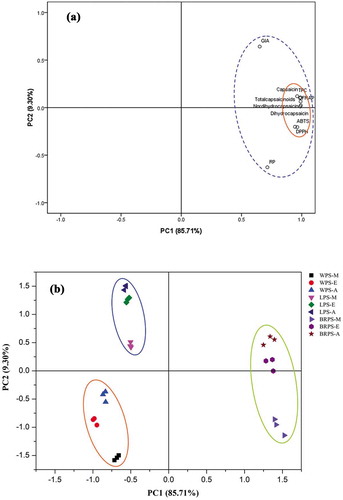
Figure 4. (a) Loading plot of principal component analysis (PCA) of total phenolic content (TPC), capsaicinoids (capsaicin, dihydrocapsaicin, nordihydrocapsaicin, total capsaicinoids), antioxidant activities, and α-glucosidase inhibitory activity. (b) Score plot of principal component analysis (PCA) of discrepant solvent extracts of WPS, LPS, and BRPS. M-, E- and A- indicate CPS (i.e., WPS, LPS, and BRPS) were extracted with 80% methanol, 80% ethanol, and 80% acetone, respectively.