Figures & data
Table 1. Details of the processed fish products investigated in this study.
Figure 1. The ratios of ATP-related compounds in various dried and salted fish and fushi products. The sample numbers are listed in.
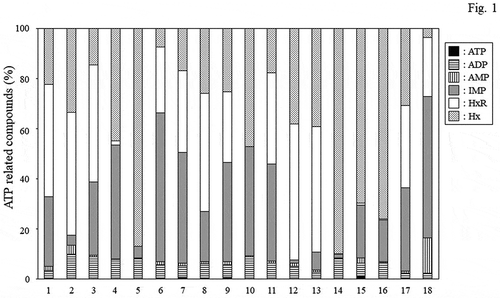
Figure 2. IMP contents in various half-dried fish and fushi products. The sample numbers are listed in.
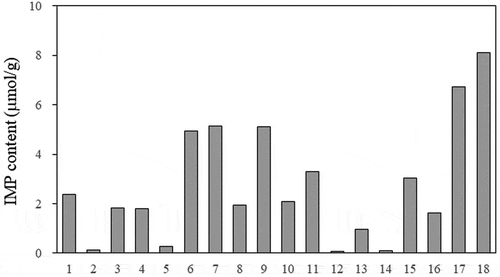
Figure 3. Changes in the IMP ratios of half-dried Japanese jack mackerel products during storage for 7 days at 5°C.
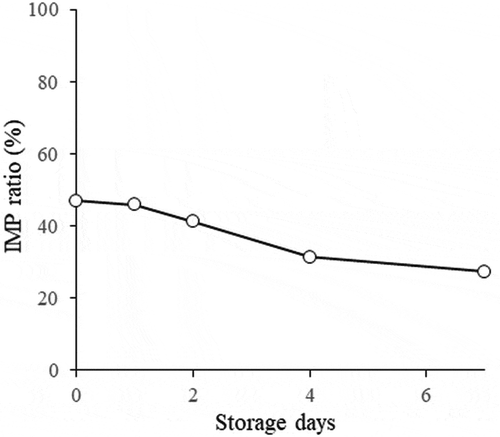
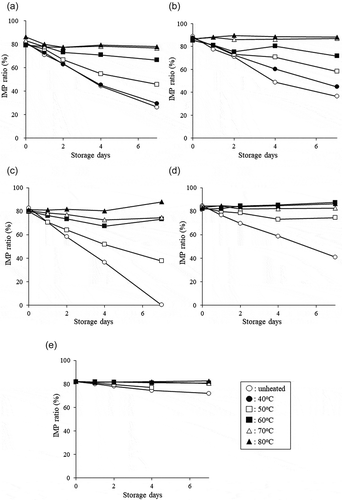
Figure 4. Changes in the IMP ratios of water extracts of club mackerel (A), Atlantic bluefin tuna (B), Japanese jack mackerel (C), fine-patterned puffer (D), and half-smooth golden pufferfish (E) stored for seven days.