
Figures & data
Figure 1. Flow chart of experimental design.
Figure 2. Effects of temperature after 3.0-h processing in water on the content of RDS, SDS, and RS in pea (a) and chickpea (b).
Table 1. Pearson correlation study on revealing relationship of processing temperature and duration of drying at 160°C and 60°C as well as content of RDS, SDS, and RS in pea and chickpea.
Figure 3. Effects of duration of 160°C drying on the content of RDS, SDS, and RS in pea (a) and chickpea (b); and effects of duration of 60°C drying on the content of RDS, SDS, and RS in pea (c) and chickpea (d).
Table 2. Amylose/amylopectin ratio of raw pea and chickpea, as well as total starch and content of RDS, SDS, and RS in pea and chickpea before and after HCHD and LCLD processing.
Figure 4. Blood glucose response to 50 g of glucose powder (Δ), HCHD-processed pea (○), and LCLD-processed pea (□) in healthy subjects (n = 10).
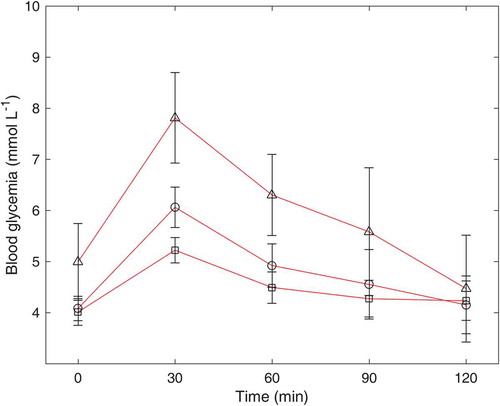
Figure 5. Blood glucose response to 50 g of glucose powder (Δ), HCHD-processed chickpea (○), and LCLD-processed chickpea (□) in healthy subjects (n = 10).
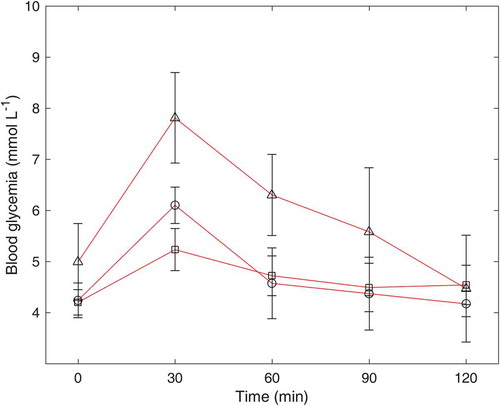
Table 3. In vivo digestibility parameters, including number, age, and BMI of panelists; and GI of the four processed pea and chickpea.
Table 4. Pearson correlation coefficients among digestibility properties of the pea and chickpea prepared by HCHD and LCLD.