Figures & data
Figure 1. α-tocopherol content (n = 3 technical replicates) in ‘Cripps Pink/Pink Lady®’ apple pulp extracted using three procedures: methanolic extraction of freeze-dried material, extraction with n-hexane of fresh apple pulp and saponification of fresh apple pulp.
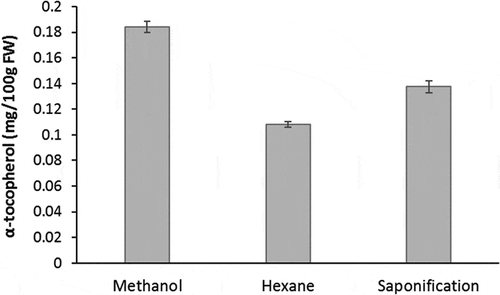
Table 1. Validation parameters of the HPLC-DAD method for the determination of α-tocopherol in apple pulp.
Figure 2. Chromatograms of α-tocopherol at 300 nm (a) and L-ascorbic acid (AsA) at 260 nm (b) of the sample LB 04852 (‘Elstar’ x ‘Braeburn’). Insert: UV/VIS spectra of the α-tocopherol and AsA peak of the apple pulp sample (in blue) and a reference standard solution (in red), respectively.
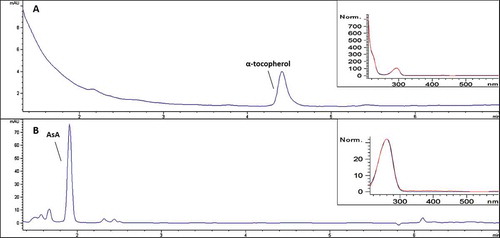
Table 2. Average content of L-ascorbic acid (AsA) and α-tocopherol (mg/100 g FW) in apple pulp and relative standard deviation (RSD in %) between the amount found in 10 apple samples for each of 24 cultivars from season 2010.
Figure 3. Box plots of the L-ascorbic acid (AsA) (a) and α-tocopherol (b) content (expressed as mg/100 g FW) in 24 apple cultivars from the 2010 season. Median values are reported (n = 10).
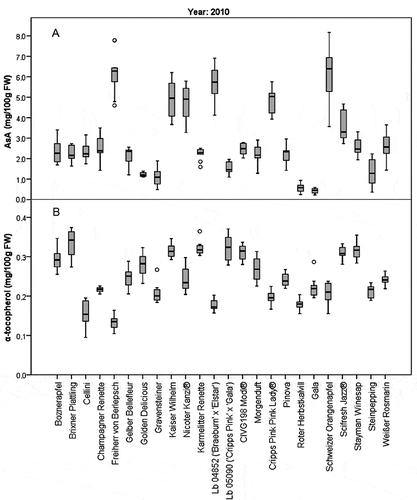
Table 3. Two-way analysis of variance (ANOVA) for the effects of the cultivar and the harvest year on the content of L-ascorbic acid (AsA) and α-tocopherol.
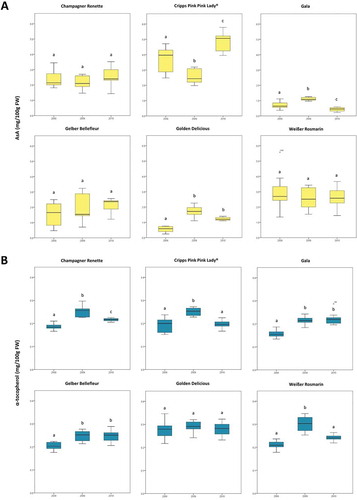
Figure 4. Box plots of the L-ascorbic acid (AsA) (a) and α-tocopherol (b) content (expressed as mg/100 g FW) in six varieties harvested over three consecutive seasons (2008 to 2010). Median values are reported (n = 10). Significant differences between the content of vitamins in the apple pulp of the same cultivar collected over three years are indicated by different letters (p < .05).