
Figures & data
Figure 1. Freezing curves of mackerel (a) and croaker (b) with various freezing temperatures
Figure 2. Thawing curves of mackerel (a) and croaker (b) with various storage temperatures
Figure 3. Changes in drip loss of thawed mackerel (a) and croaker (b) depending on various freezing temperatures and storage periods. a-dMeans with different lowercase letters within the same storage temperature are significantly different (p< .05). A-CMeans with different uppercase letters within the same storage month are significantly different (p< .05)
Figure 4. Changes in water-holding capacity (WHC) of thawed mackerel (a) and croaker (b) depending on various freezing temperatures and storage periods
Table 1. Changes in the color of thawed mackerel depending on various freezing temperatures and storage periods
Table 2. Changes in the color of thawed croaker depending on various freezing temperatures and storage periods
Figure 5. Changes in the appearance of thawed mackerel (a) and croaker (b) depending on various freezing temperatures and storage periods. Mon, month
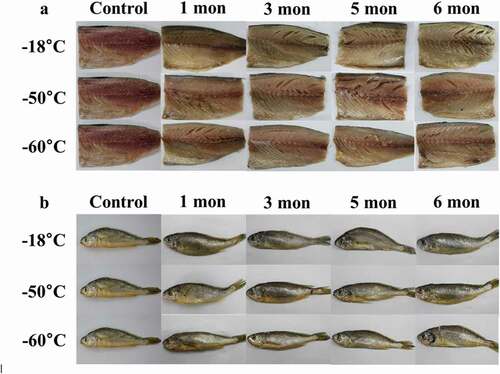
Figure 6. Changes in thiobarbituric acid reactive substances (TBARS) of thawed mackerel (a) and croaker (b) depending on various freezing temperatures and storage periods
Figure 7. Changes in total volatile basic nitrogen (TVBN) of thawed mackerel (a) and croaker (b) depending on various freezing temperatures and storage periods
Table 3. F-values for parameters of mackerel and croaker depending on various freezing temperatures and storage periods