Figures & data
Table 1. Element composition of chickpea flour (CF) and wheat flour (WF) (g/100 g)
Table 2. Mixolab parameters, dough rheological, structural, and pasting properties of flour blends of wheat flour (WF) and chickpea flour (CF) treated by transglutaminase (TGase)
Figure 1. Effect of CF addition and TGase treatment at various dosage on dynamic moduli (G´, Gʺ), Tan δ and complex modulus (η*) of dough made from wheat flour (WF) supplemented with 10% and 20% chickpea flour (CF). □, WF (control); black solid symbols, WF+10%CF; blue solid symbols, WF+20%CF
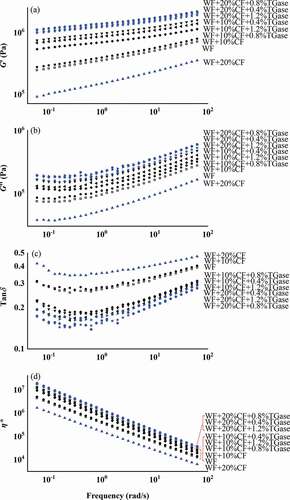
Figure 2. Scanning electron microscopy images of noodle samples. Left panel: raw noodles; Right panel: cooked noodles. From top to bottom: WF (A and B), WF+10%CF (C and D), WF+20%CF (E and F), WF+10%CF+0.4%TGase (G and H), and WF+20%CF+0.8%TGase (I and J). Abbreviations: WF, wheat flour; CF, chickpea flour; and TGase, transglutaminase
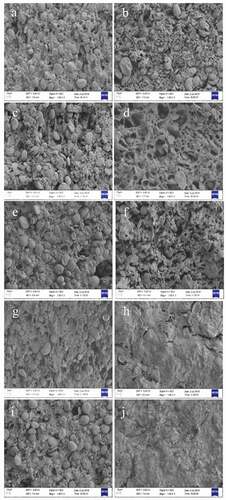
Table 3. Noodle color, noodle cooking quality, and sensorial properties of flour blends of wheat flour (WF) and chickpea flour (CF) treated by transglutaminase (TGase)
Table 4. The quantification of some main protein subunits of SDS-PAGE electrophoretograms
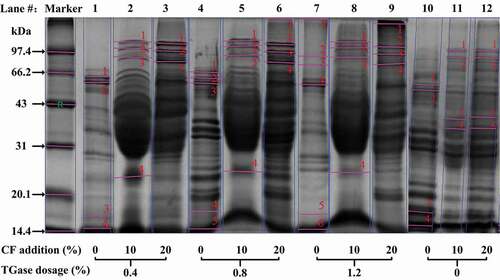
Figure 3. SDS-PAGE of cooked noodles. Left lane: standard marker. CF addition level (%) and TGase dosage (%) are indicated at bottom for Lane # 1–12. Lane #1, #4, #7 and #10 are wheat flour control (0% CF); and Lane #10, #11 and #12 are TGase treatment control (0% TGase). The results indicated that chickpea proteins were involved in the cross-linked network catalyzed by TGase