Figures & data
Figure 1. Schematic of olfactory system used (a) Air filter (Carbone active), (b) Sample compartment, (c) Solenoid valve, (d) Diaphragm pump, (e) Sensor array, (f) Date acquisition card, (g) PC and (h), Air outlet
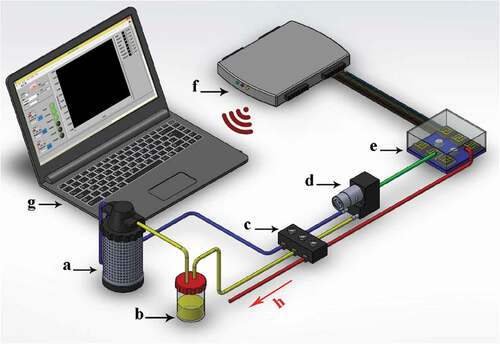
Table 1. The used sensors in electronic nose
Figure 2. Schematic of multilayer perceptron neural network

Figure 3. Radar graph response of the sensors for the different types of fruit juices obtained by e-Nose
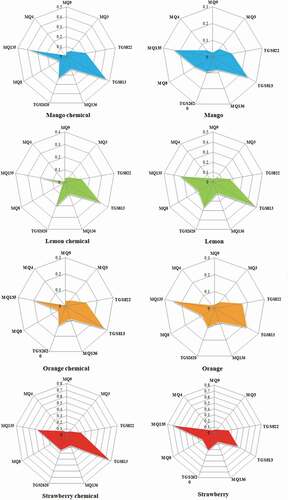
Figure 4. Loading plot for PCA analysis for fruit juices
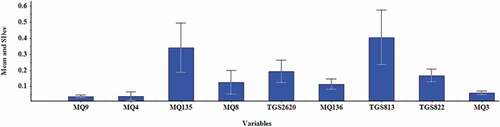
Figure 5. Power of MQ135 and TGS813 sensors response to VOC of different fruit juice samples (PC-1)
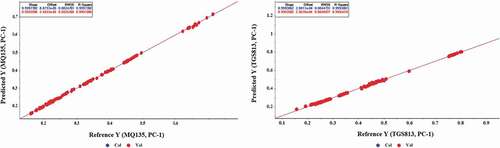
Table 2. Summary of PCR analysis results
Figure 6. Correlation plots of the calculated versus the experimental a) all sample, b) pure and industrial sample
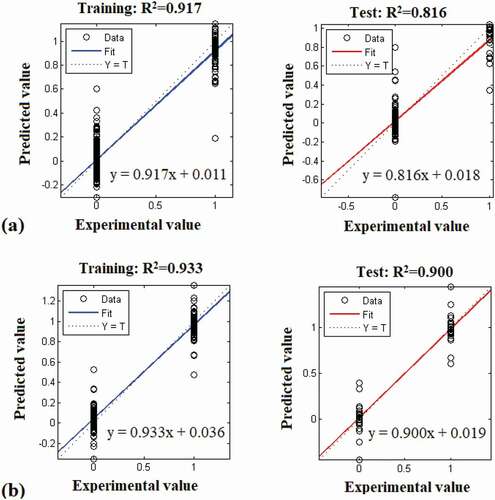
Table 3. Performance parameters of ANN models
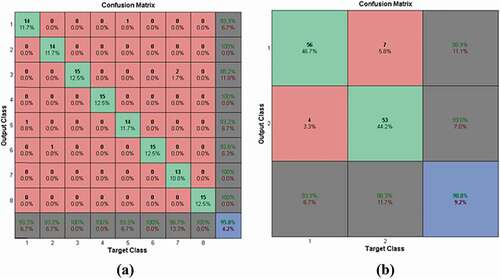
Figure 7. Confusion matrix obtained for a) all juices, b) pure and industrial juices