Figures & data
Table 1. List of primes used in the present study
Table 2. Identification of meat of different animal species by PCR-RFLP of 12s rRNA gene
Figure 1. Amplification of 456bp DNA fragments from mitochondrial 12S rRNA gene of sheep, cattle, buffalo, goat and pig meat samples. Lane M: 100 bp DNA marker, Lane Pc: positive control (known beef sample). Individual meat sample is marked in the figure
Figure 2. RFLP of 456bp fragment of mitochondrial 12S rRNA gene for differentiation of meat from different species of animals. Digestion pattern of 456bp DNA fragments of different species by a) AluI, b) ApoI, c) BspTI, and d) HhaI. Different fragment sizes are indicated in the figure. Lane M: DNA marker
Table 3. Detection and differentiation of mixed meat samples by PCR-RFLP
Figure 3. Identification two different species of meat animal with species specific primers based on mitochondrial 12S rRNA gene. Amplification of a) 225bp DNA fragment from mutton (Sheep) and b) 271bp DNA fragment from beef (Cattle) sample. Lane M: DNA marker, Lane 1–4: tested samples
Figure 4. Phylogenetic analysis of mitochondrial 12S rRNA gene of Cattle (Bos indicus), Buffalo (Bubalus bubalis), Sheep (Ovis aries), Goat (Capra hircus) and Pig (Sus scrofa). The tree was inferred using Neighbor-Joining method with 1000 bootstrap replication. Sequences generated in this study are marked with black circle in the tree. The percentage of replicate trees in which the associated taxa clustered together in the bootstrap test is shown next to the branches. The tree is drawn to scale, with branch lengths in the same units as those of the evolutionary distances used to infer the phylogenetic tree. The evolutionary distances were computed using the Maximum Composite Likelihood method and are in the units of the number of base substitutions per site
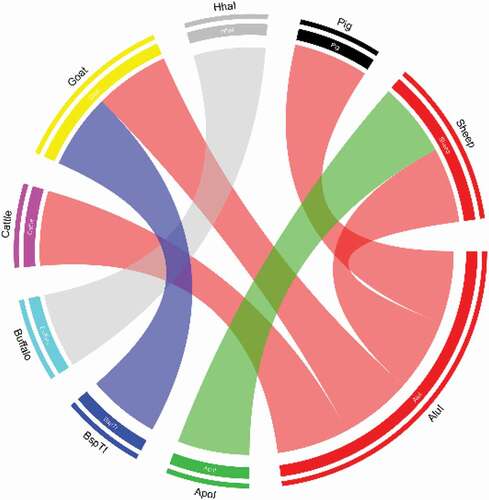
Figure 5. Chord analysis of restriction enzymes in portion of 12S rRNA gene of cattle, buffalo, goat, sheep and pig. In the diagram all four different types of colored arcs are originates from four different restriction enzymes. Color of each type of arcs indicates their cutting or digestion capacity against amplified 12S rRNA DNA fragment of meat sample of five different animals tested. Here, red color indicates restriction enzyme AluI, green indicates ApoI, blue indicates BspTI, and gray indicates HhaI