Figures & data
Figure 1. Reversed-phase HPLC-ESI-MS of proanthocyanidins (PAs) extracted from leaves (a) and branches (b) in Cinnamomum camphora. C: catechin; C-thio: catechin benzylthioether; C/EC-thio: catechin/epicatechin benzylthioether; AF/EAF: afzelechin/epiafzelechin; BM: benzyl mercaptan
Table 1. Inhibition activity and constants of proanthocyanidins (PAs) extracted from leaves and branches of Cinnamomum camphora.
Figure 2. Inhibition effects of proanthocyanidins (PAs) extracted from leaves and branches in Cinnamomum camphora on monophenolase (a), diphenolase (b) activity and inhibitory mechanism (c) of mushroom tyrosinase. Progress curve for the oxidation of L-Tyr by the enzyme. In leaves, the concentrations of proanthocyanidins (PAs) for curve 0–4 was 0, 33.33, 66.67, 133.33 and 200 μg/mL, respectively. In branches, curves 0–4 represent the reaction curve of the system when the concentration of proanthocyanidins (PAs) was 0, 76.67, 153.33, 230 and 306.67 μg/mL, respectively. Effects of proanthocyanidins (PAs) on the steady-state rate of monophenolase. Effects of proanthocyanidins (PAs) on the lag time of mushroom tyrosinase. In leaves, lines 0–4 represent the reaction curve of the system when the concentration of proanthocyanidins (PAs) was 0, 13.33, 40, 66.67, 93.33 μg/mL. In branches, lines 0–4 represent the reaction curve of the system when the concentration of proanthocyanidins (PAs) was 0, 30.67, 46, 76.67, 92 μg/mL
Figure 3. Determination of the inhibitory type and constants of proanthocyanidins (PAs) extracted from leaves (a) and branches (b) of Cinnamomum camphora. In leaves, lines 0–4 represent the reaction curve of the system when the concentration of proanthocyanidins (PAs) was 0, 13.33, 40, 66.67, 93.33 μg/mL with L-DOPA as substrate. In branches, lines 0–4 represent the reaction curve of the system when the concentration of proanthocyanidins (PAs) was 0, 30.67, 46, 76.67, 92 μg/mL. The plot of intercept versus proanthocyanidins (PAs) concentration for determining the inhibition constants KIS. The plot of slope versus PAs concentration for determining the inhibition constants KI.
Figure 4. The UV-Vis spectra of the oxidation of L-Tyr by tyrosinase. (a): L-Tyr; (b): L-Tyr + leaves proanthocyanidins (PAs); (c): L-Tyr + branches proanthocyanidins (PAs). Lines 0–11 represent 0–11 minutes after enzyme addition
Figure 5. The UV-Vis spectra of the oxidation of L-DOPA by NaIO4 in the absence and presence of proanthocyanidins (PAs) from leaves (a) and branches (b) of Cinnamomum camphora.
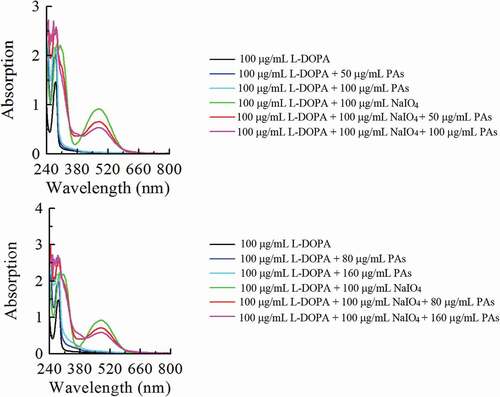
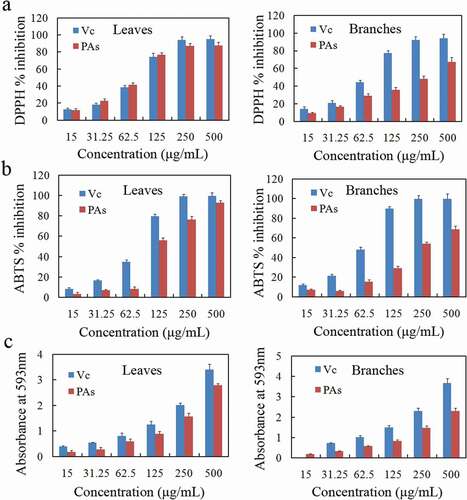
Table 2. Comparison of antioxidant capacity between leaves and branches proanthocyanidins (PAs) from Cinnamomum camphora. and VC
Figure 6. The antioxidant activity of the leaves and branch proanthocyanidins (PAs) from Cinnamomum camphora. is determined by 2,2-Diphenyl-1-picrylhydrazyl (DPPH) assay (a), 1,2ʹ-azino-bis(3-ethylbenzthiazoline-6-sulphonicacid) (ABTS) assay (b) and ferric reducing antioxidant power (FRAP) assay (c)