Figures & data
Figure 1. Bacterial disinfection process by plasma-generated reactive species
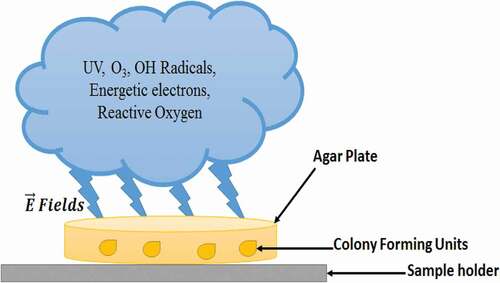
Figure 2. (a) Schematic diagram of experimental set-up. (b) Visuality of discharge at 0 mbar Pressure (c) visuality of discharge at 0.1 m bar Pressure
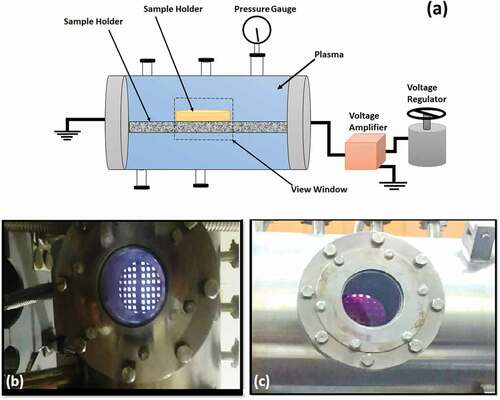
Figure 3. (Color online) Spectral emission profiles of ROS with and without
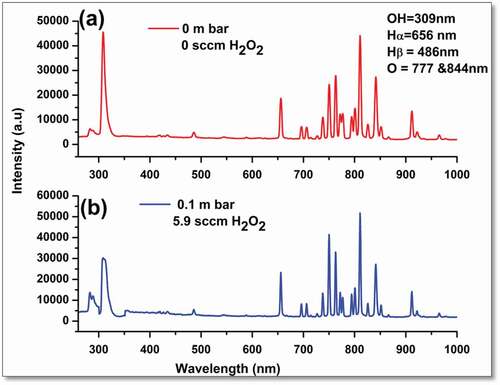
Figure 4. (Color online) Normalized density of ROS with and without
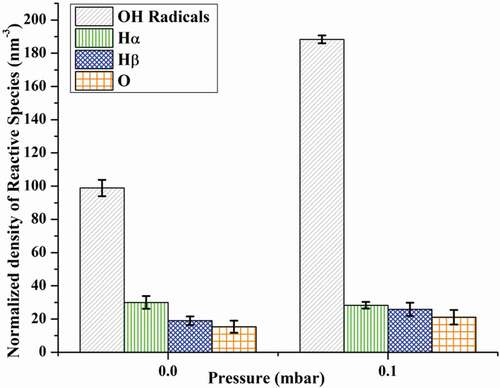
Figure 5. (Color online) Graphical and visual representation of E.coli colonies under different experimental conditions. (a) Pure strain of E.coli cultured Agar plates with 107CFU’s
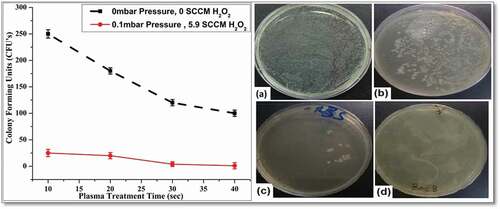
Figure 6. (a) Inactivation efficiency of plasma on E.coli cells. (b) Kill rate for different plasma treatment times
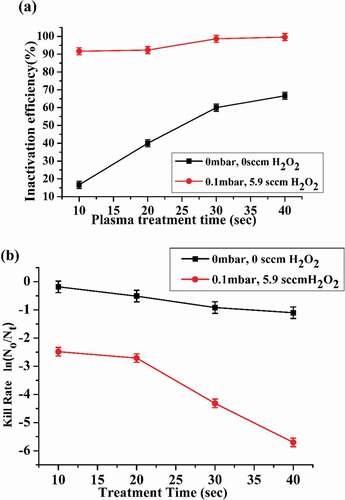
Figure 7. (a) DNA quantification of plasma treated E.coli samples. (b) Protein leakage tests of plasma treated E.coli samples for different durations
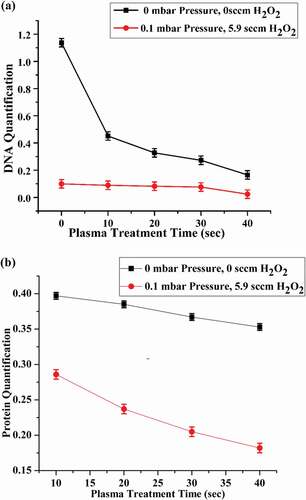
Figure 8. Typical SEM images of plasma-treated agar plates