Figures & data
Figure 1. Isolation of P. lactiflora stamens. A: Blooming flower; B: Remaining part of flower after removing the petals; C: Separate stamens; D: Stamens after a series of treatments
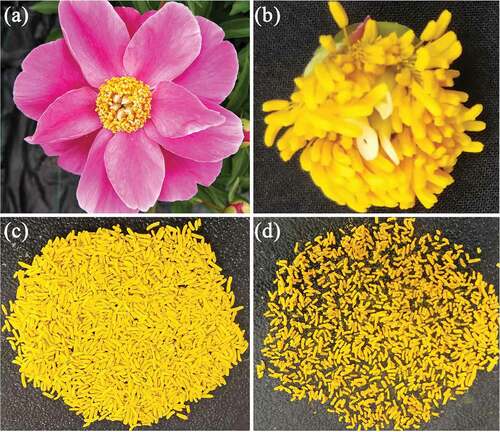
Figure 2. Reducing capacity and free radical scavenging activity of P. lactiflora stamen extract. The values represented the mean ± SD, and different letters indicate significant differences according to Duncan’s multiple range test (P < .05)
Figure 3. Effects of P. lactiflora stamen extract on safety of C. elegans. A: Effects of stamen extract on lethality, growth, locomotion behavior and reproduction of nematodes; B: Effects of stamen extract on intestinal autofluorescence of nematodes. The values represented the mean ± SD, and different letters indicate significant differences according to Duncan’s multiple range test (P < .05)
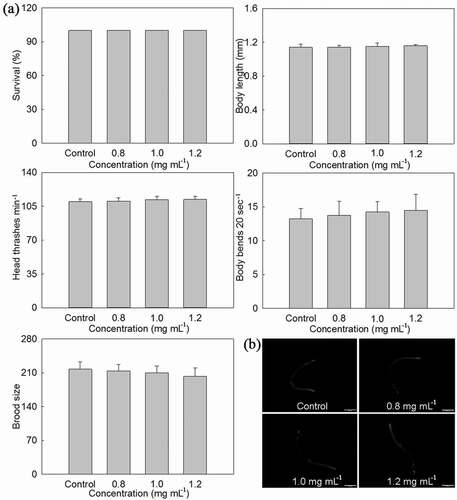
Figure 4. Effects of P. lactiflora stamen extract on lifespan of C. elegans. A: Lifespan curves of nematodes treated with stamen extract; B: Comparison of mean lifespan and maximal lifespan in nematodes treated with stamen extract. The values represented the mean ± SD, and different letters indicate significant differences according to Duncan’s multiple range test (P < .05)
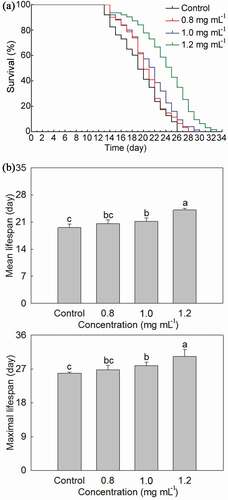
Figure 5. Effects of P. lactiflora stamen extract on locomotion behavior of C. elegans. The values represented the mean ± SD, and different letters indicate significant differences according to Duncan’s multiple range test (P < .05)
Figure 6. Effects of P. lactiflora stamen extract on intestinal autofluorescence and reproduction of C. elegans. A: Effects of stamen extract on intestinal autofluorescence of nematodes; B: Fluorescence intensity of intestinal autofluorescence; C Effects of stamen extract on reproduction of nematodes. The values represented the mean ± SD, and different letters indicate significant differences according to Duncan’s multiple range test (P < .05)
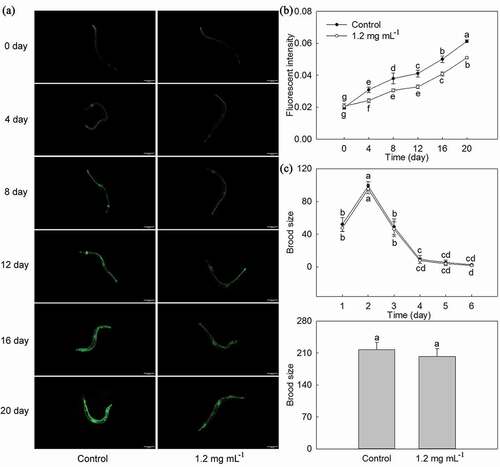
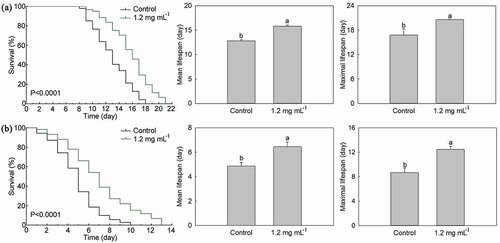
Figure 7. Effects of P. lactiflora stamen extract on stress resistance of C. elegans. A: Lifespan curves of C. elegans treated with stamen extract and their comparison of mean lifespan and maximal lifespan under heat stress; B: Lifespan curves of C. elegans treated with stamen extract and their comparison of mean lifespan and maximal lifespan under oxidative stress. The values represented the mean ± SD, and different letters indicate significant differences according to Duncan’s multiple range test (P < .05)