Figures & data
Table 1. Inhibition of DPPH and ABTS by MDAL and MDAQ (1 mg/mL) and their corresponding phenolic contents
Figure 1. LOX-1 enzyme inhibition by MDAL and MDAQ (1 mg/mL) in comparison with quercetin (1 mg/mL) and nordihydroguiaiaretic acid (NDGA – 0.0018 mg/mL). Data were obtained as mean values of 3 independent tests and presented as ± SD
Figure 2. HPLC, FTIR, and LC-MS/MS profile of Quercetin Glycoside-QG. HPLC profile of QG on C-18 column (preparative), detection wavelength at 360 nm (a). Fourier transform infrared spectra of QG was obtained in the spectral range of 4000–400 cm−1 (b). LC-MS analysis using High-Resolution Mass Spectrometry (HRMS) of QG in the negative ion mode in the range of 100–2000 m/z. Inset represents the MS/MS pattern of QG (c)
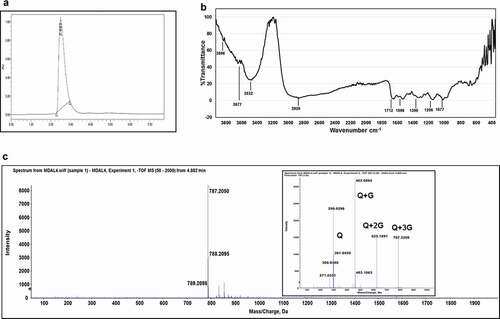
Figure 3. Structure of Quercetin-3-O-diglucoside-7-O-glucoside (QG) based on different spectroscopy data
Figure 4. Inhibition of LOX-1 by QG at different concentrations (0.1–10 mM) (a). Time course of LOX-1 inhibition by different concentrations of QG. The concentrations of QG used were 0 mM (―♦―), 0.4 mM (―□―), 0.8 mM (―▲―), 1 mM (―x―) and 2 mM (―●―) (b). Inhibition of hyaluronidase by QG at different concentrations ranging from 31.25–2000 μM (c). Data were obtained as mean values of 3 independent tests
Figure 5. Inhibition of DPPH* by QG (―■―) at various concentrations (18.75–300 μM) in comparison with ascorbic acid (―▲―) at different concentrations (35.5–568 μM) (a). Inhibition of ABTS⁺ by QG (18.75–300 μM) in comparison with a standard molecule Trolox® (25–200 μM). Inhibition percentage of ABTS⁺ by QG at 10 min (―■―) and 2 h (―●―) incubation and Trolox at 10 min (―♦―) and 2 h (―▲―) incubation are shown (b). Data were obtained as mean values of 3 independent tests
Figure 6. Inhibition of LPS induced inflammatory response by QG in RAW 264.7 cells. The effect of QG on cells’ viability at various concentrations (1–1000 µg/mL) was confirmed by MTT assay (a). Cells were pre-incubated with 50, and 100 µM of quercetin glycoside (QG50 and QG100) for 30 min, followed by stimulation with LPS, and the levels of ROS (b), NO (c), and IL-6 (d) were measured. Quercetin at 10 µM (Q10) was used as a positive control. *P < .05, **P < .01, ***P < .001 vs. LPS