
Figures & data
Table 1. Chemical analysis of the total dietary fiber (TDF), insoluble dietary fiber (IDF) and soluble dietary fiber (SDF) in non-edible artichoke bracts
Figure 1. ATR-FTIR spectra of bracts from: “blanco madrigal” (AR-Argentina, green curve), “violetto di Sicilia” (SC-Italy, red curve), “bianco di Benevento” (BN-Italy, black curve)
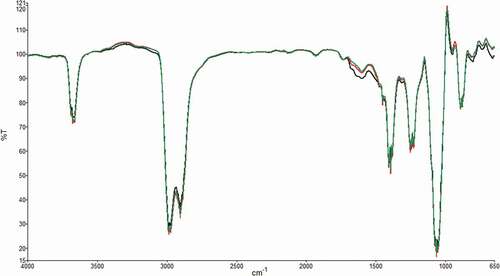
Figure 2. ATR-FTIR spectra of soluble (a) and insoluble (b) fractions of artichoke bracts. Samples: AR (green curve), SC (red curve), BN (black curve)
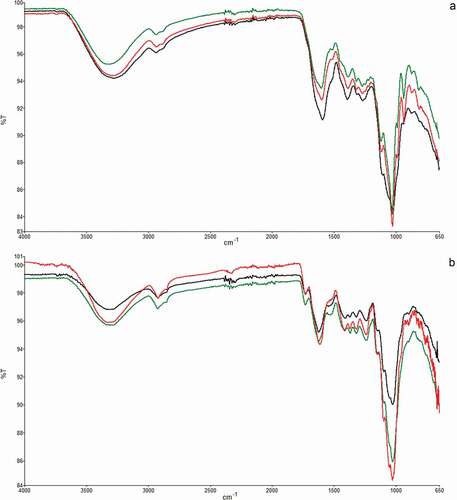
Table 2. Assignment of ATR-FTIR peaks of artichoke insoluble and soluble fiber of AR, BN and SC samples analyzed with SIMCA
Table 3. Interclass distance of insolube (IF) and soluble fibers (SF) of AR, BN and SC samples at the spectal ranges analyzed with SIMCA
Figure 3. SIMCA analysis for insoluble fiber samples (AR, SC, BN)
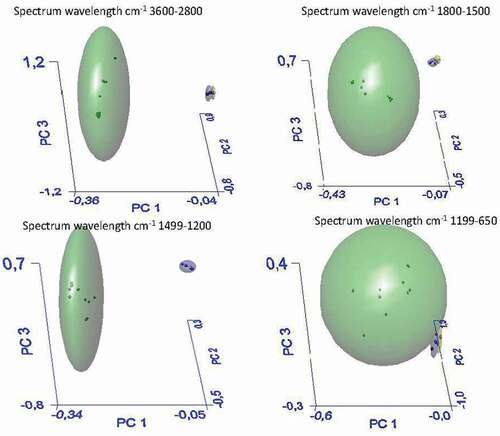
Figure 4. SIMCA analysis for soluble fiber samples (AR, SC, BN)
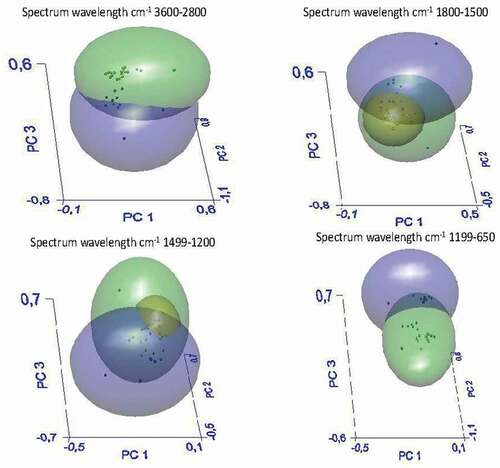
Figure 5. SIMCA analysis soluble fiber vs. insoluble fiber of all samples
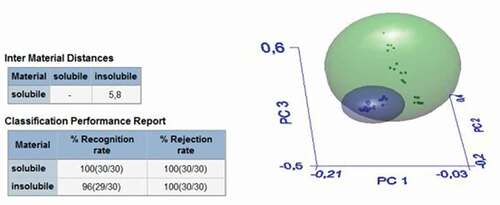
Table 4. Anova OneWay of insolube (IF) and soluble fibers (SF) of AR, BN and SC samples in the following spectral band regions: A) 3600–2800 cm−1; B) 1800–1500 cm−1; C) 1499–1200 cm−1; D) 1199–650 cm−1; E) 4000–650 cm−1.