Figures & data
Figure 1. Photos of the test house
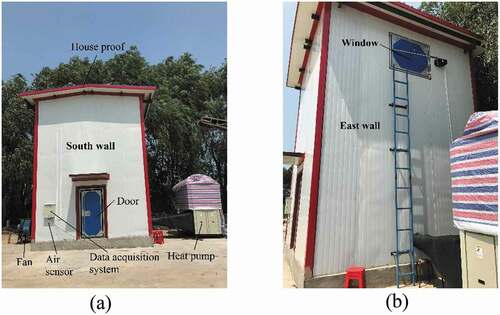
Figure 2. Cloud image sections and heights of the test house and bulk corn. Front view (a) and end view (a) show separately the three vertical sections, i.e., V1, V2, and V3, and three horizontal sections, i.e., H1, H2, and H3, in the bulk corn. (b) shows the locations of temperature sensors and bin sensor in the test house. Each solid circle indicates a temperature sensor location. (c) ■ is sampling points for detecting MC and fungal spores during the test
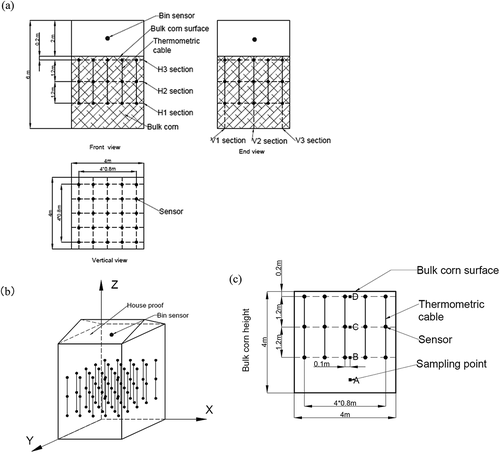
Figure 3. MC changes of the bulk corn at monitoring points A, B, C and D
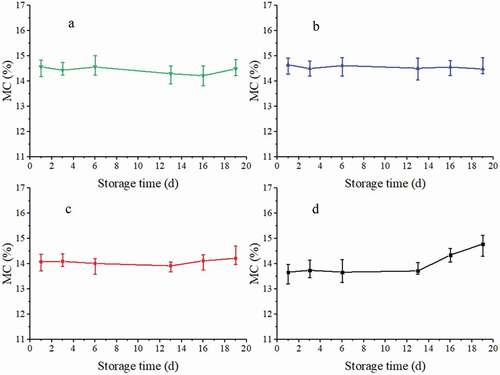
Figure 4. The changes of fungal spore counts of the bulk corn at monitoring points A, B, C and D
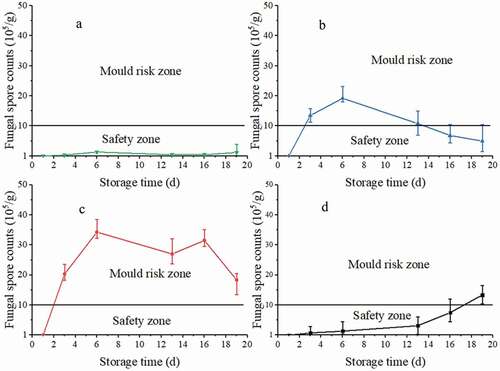
Figure 5. Air temperature and relative humidity outside the test house monitored by the air sensor in
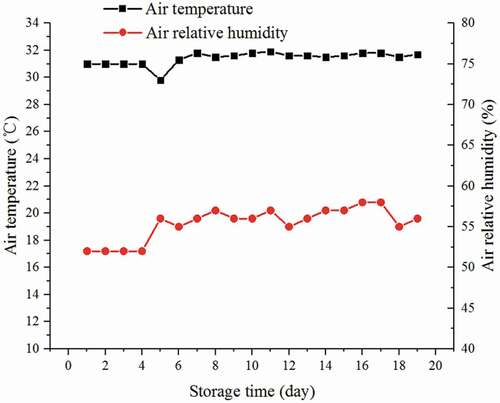
Figure 6. Temperature changes in the bulk corn in three vertical sections. (V1-a,V2-a,V3-a) storage for 1 day;(V1-b,V2-b,V3-b) storage for 11 days; (V1-c,V2-c,V3-c) storage for 19 days
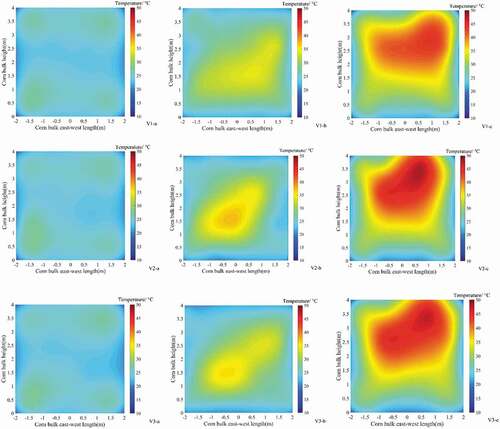
Figure 7. Temperature changes in the bulk corn in three horizontal sections. (H1-a,H2-a,H3-a) stored for 1 day;(H1-b,H2-b,H3-b) stored for 11 days; (H1-c,H2-c,H3-c) stored for 19 days. Section H1,1.4 m bulk height; Section H2, 2.6 m bulk height; Section H3, 3.8 m bulk height

Figure 8. The areas change of high temperature zone in the three vertical sections and three horizontal sections

Table 1. Parameters in equation (2)
Table 2. Parameters in equation (3)
Figure 9. Relationship between the equivalent radius and temperature difference of high temperature zones in three vertical sections (section V1,V2,V3) and three horizontal sections (section H1,H2,H3). Predicted line was the fitting curve of equivalent radius rapidly rising

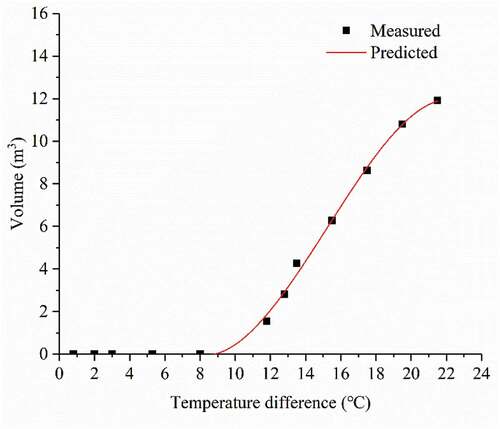
Figure 10. Relationship between the high temperature zone volume and temperature difference. Predicted line was the fitting curve of equivalent radius rapidly rising