Figures & data
Table 1. Six methods of thawing frozen cuttlefish
Figure 1. Thawing curve of cuttlefish under different thawing methods.
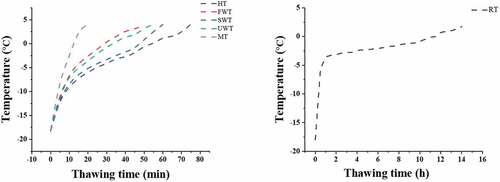
Figure 2. Comparison of water retention of cuttlefish by different thawing methods. Thawing loss(A). Water holding capacity(B).Cooking loss(C).The letters “a–c” indicate significant differences (P < .05). Error bars show standard deviation.
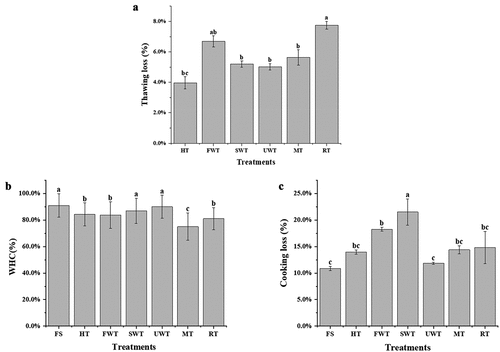
Table 2. Comparison of whiteness values and texture of different thawing methods
Figure 3. The effect of different thawing treatments on water migration in cuttlefish meat. LF-NMR T2(A), T21 (B), T22 (C) and T23 (D) relaxation time distributions of cuttlefish with different thawing processes. The percentage of the integral area of different T2 intervals to the total area was shown in Figure 3E. The letters “a–e” indicate significant differences (P < .05). Error bars show standard deviation.
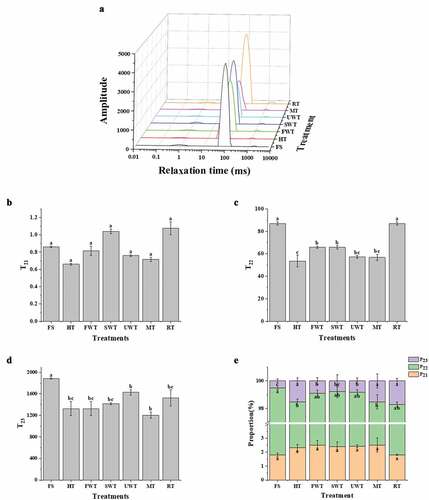
Figure 4. Magnetic resonance imaging (MRI) of cuttlefish by different thawing methods.
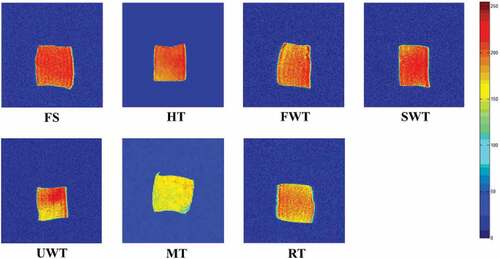
Figure 5. The effect of different thawing methods on cuttlefish TVB-N(A). The effect of different thawing methods on cuttlefish MDA(B). Comparison of the total sulfhydryl content of cuttlefish under different thawing methods(C).
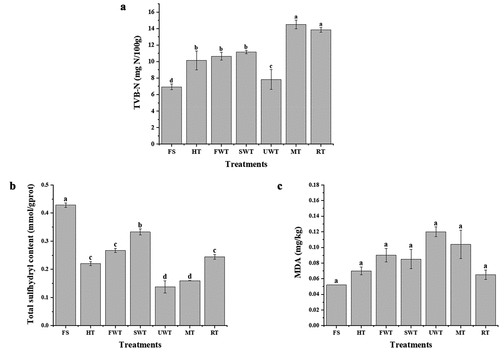
Figure 6. Effect of different thawing methods on ATR-FTIR spectra (A), secondary structure content (B), second-derivative fitted curve of the Amide I band (C) of myofibrillar protein in cuttlefish. The letters “a–c” indicate significant differences (P < .05).
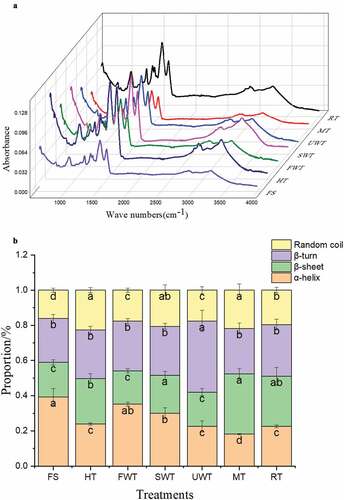
Figure 6. Continued.
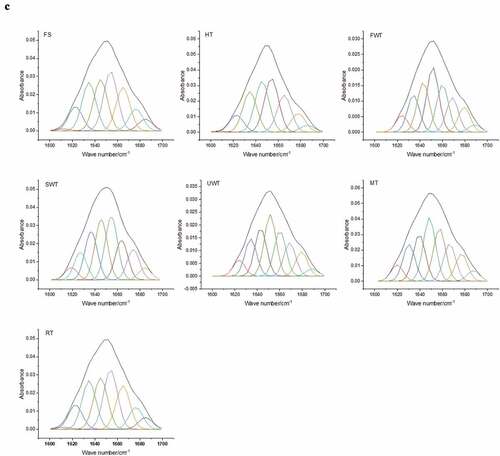
Figure 7. Comparison of the intrinsic fluorescence emission spectra of MP of cuttlefish under different thawing methods.
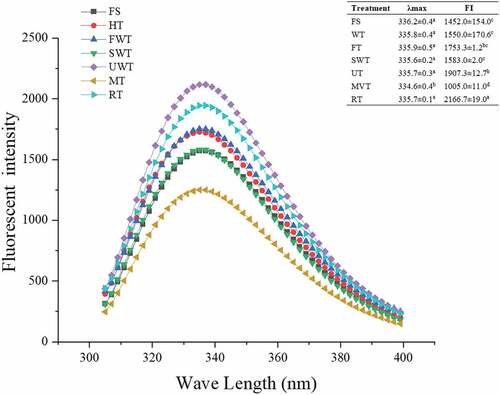
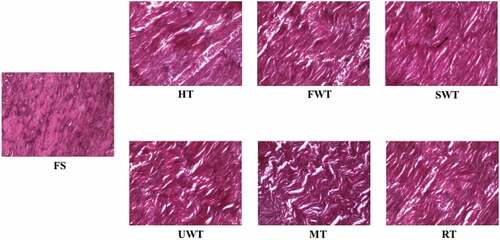
Figure 8. Comparison of microscopic observation of cuttlefish under different thawing methods. Arrows indicate cellular substances.