
Figures & data
Figure 1. Change of central temperature (A), thawing loss (B), centrifugation loss (C) and cooking loss (D) of spiral tunnel freezing (SF), quick freezer freezing (QF), refrigerator freezing (RF) and plate freezing (PF) groups during frozen storage. The different letters in the figure mean significant difference (p < .05).
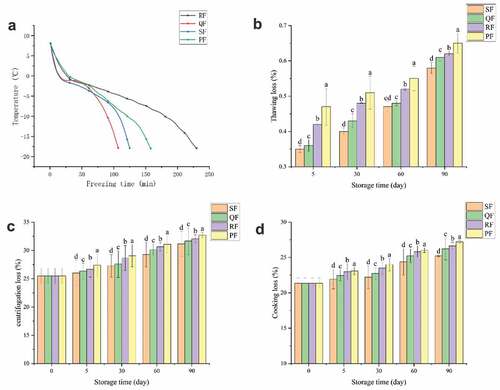
Figure 2. Change of L* (A), b* (B) of sample color, hardness (C) and elasticity (D) of SF, QF, RF and PF groups during frozen storage. The different letters in the figure mean significant difference (p < .05).
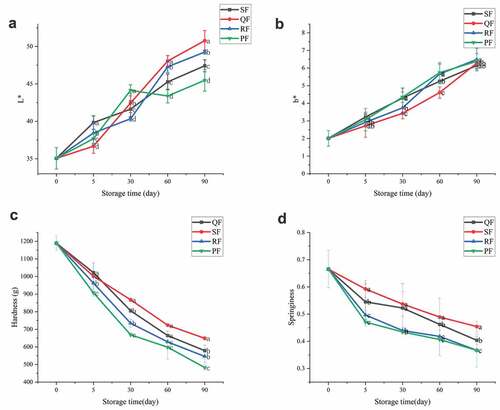
Figure 3. Change of electrical conductivity (A), TVB-N (B), MDA (C) and K-value (D) of SF, QF, RF and PF groups during frozen storage. The different letters in the figure mean significant difference (p < .05).
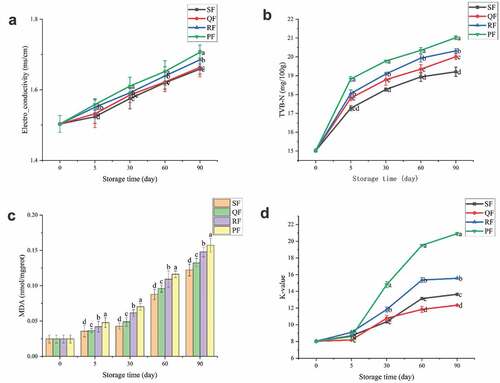
Figure 4. Change of sulfhydryl content (A) and magnetic resonance imaging (MRI) (B) of SF, QF, RF and PF groups during frozen storage. The different letters in the figure mean significant difference (p < .05).
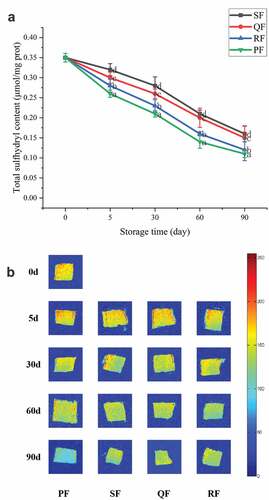
Table 1. Effects of different freezing methods on secondary structure contents from amide I band region of different components in mackerel during frozen storage
Table 2. Effects of different freezing methods on water ratio of different components in mackerel during frozen storage