
Figures & data
Table 1. The changes in physical characteristics of six jujube cultivars during Blackening processing
Figure 1. A) Six jujube cultivars before and after blackening processing; B) Color difference (ΔE) of six jujube cultivars after blackening processing.

Figure 2. Relative contents of some volatiles of RJ and BJ.
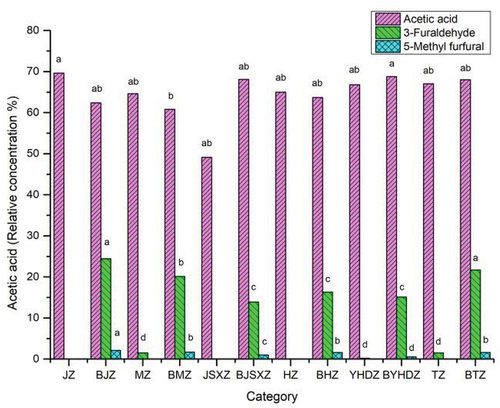
Table 2. Linear regression correlation established between volatile compounds and color difference
Table 3. Color of six jujube cultivars during the blackening processing
Table 4. Correlations of color value and part of volatile compounds relative concentration of jujubes
Figure 3. Results of linear regression correlation of volatile compounds and color difference A) histogram of V44: 3-Furaldehyde and color difference; B) Normal P-P Plot of Regression Standardized Residual of Dependent Variable of V44: 3-Furaldehyde and Color difference; C) Partial Regression Plot of a and V44: 3-Furaldehyde.
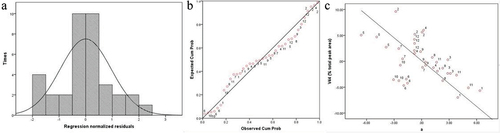
Figure 4. Dendrogram cluster analysis of six jujube cultivars with red and blackened.
Figure 5. Principal component analysis of six jujube cultivars (BJs and RJs).
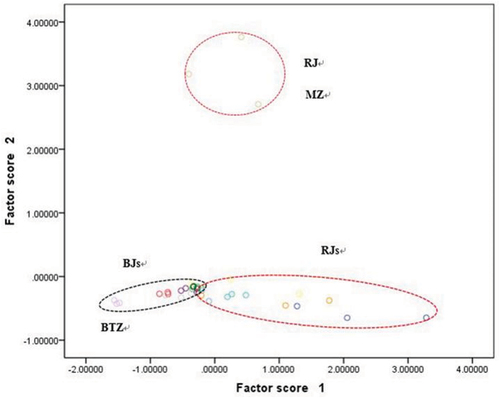
Table 5. Eigenvalues, proportion of variation and eigenvectors associated with five principal components for the jujube
Figure 6. Omega-6 and omega-3 of six jujube cultivars during blackening processing.
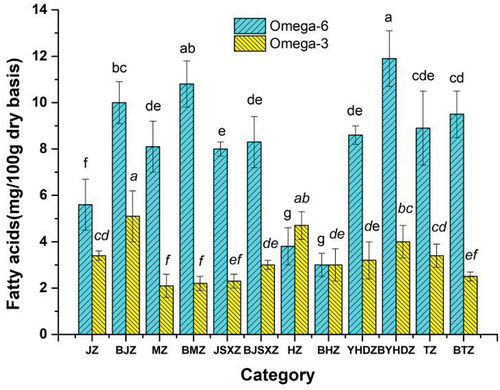
Table 6. Correlation coefficient between the parts of fatty acids and volatile compounds of jujubes
Table 7. Correlation equation between the C6:0 and parts of volatile compounds
Figure 7. A) Principal component analysis (PC1 and PC2) of FAs of jujubes; B).
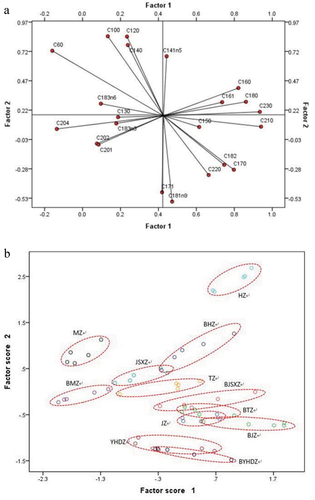
Table 8. Eigenvalues, proportion of variation and eigenvectors associated with five principal components for the jujube fruits