Figures & data
Figure 1. Hyperspectral online grading system.
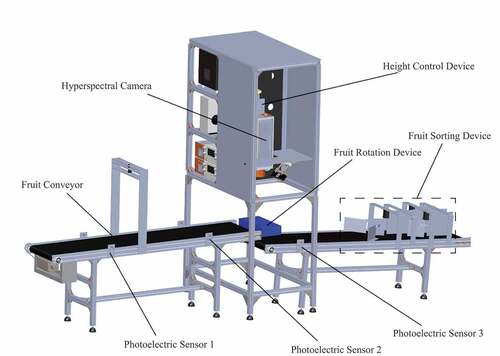
Figure 2. Sample preparation of three textural test methods of (a) TPA (b) puncture (c) shear.
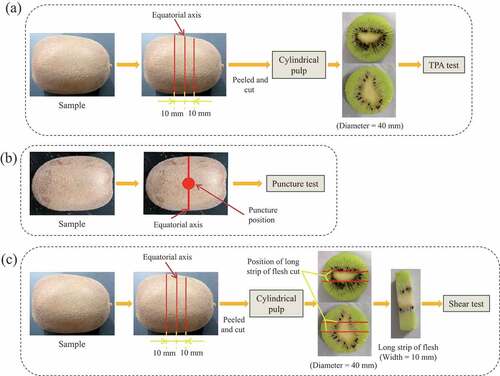
Figure 3. The characteristic curves kiwifruit texture properties by (a) TPA test (b) puncture test and (c) shear test.
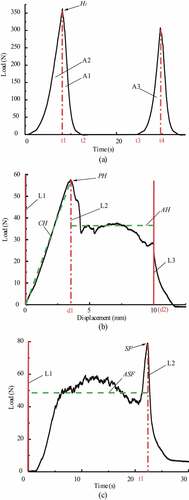
Table 1. Statistical results of kiwifruit texture characteristics in the calibration and prediction.
Figure 4. Average spectra of kiwifruit samples.
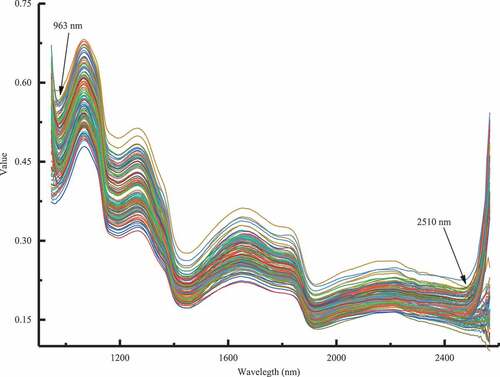
Table 2. Prediction results of kiwifruit texture characteristics by PLS.
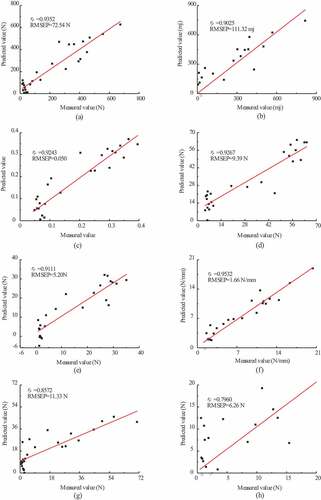
Figure 5. Correlation between predicted and measured values of (a) H1 (b) Chewiness (c) Resilience (d) PH (e) AH (f) CH (g) SF (h) ASF.