Figures & data
Table 1. Watermelon cultivars selected for this study.
Figure 1. Averages of pulp color parameters of the five watermelon cultivars studied. (a): mean of total color, E; (b): mean of brightness, L*; (c): mean of b*; (d): mean of a*.
Figure 2. pH and titratable acidity of the watermelon cultivars juice.
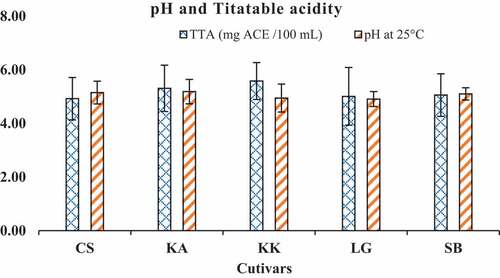
Figure 3. Average of total phenolic contents of the cultivars studied.
Figure 4. Average of total flavonoids contents of the studied cultivars.
Figure 5. Tannins contents of the cultivars studied.
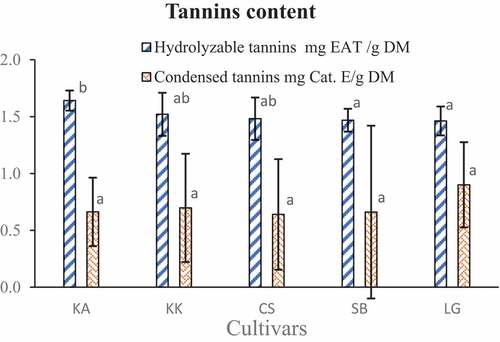
Figure 6. Average total anthocyanidin contents of the cultivars studied.
Figure 7. Average lycopene content of the studied watermelon cultivars.
Figure 8. Average β-carotene content of the studied watermelon cultivars.
Table 2. Antioxidant activity of watermelon cultivars studied.
Table 3. Correlation matrix (Pearson).
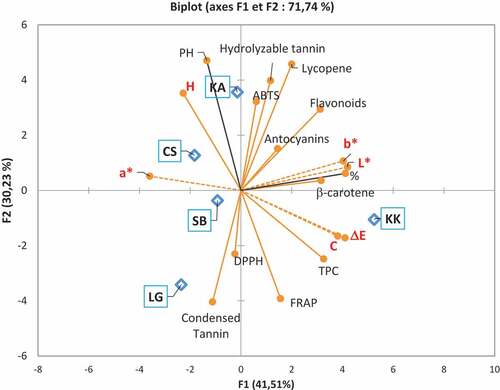
Figure 9. Parameters and samples principal component analysis.