Figures & data
Table 1. Analyzed fatty acid composition of lingonberry.
Table 2. Analyzed mineral content of lingonberry.
Table 3. Analyzed antioxidant and antidiabetic effects of lingonberry.
Table 4. Viscosity of lingonberry juice added with thickening agent.
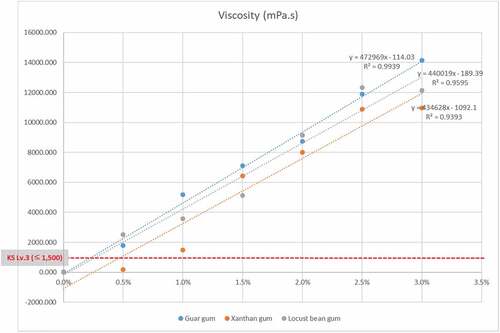
Figure 1. Regression equation for viscosity of lingonberry juice added with thickening agent. The y-scale is “Viscosity (mPa.s),” and the x-scale is “thickening agent concentration (%).” The coefficient of determination (R2) is a number between 0 and 1 that measures how well a statistical model predicts an outcome, and a higher coefficient is an indicator of a better goodness of fit for the observations. In the KS related to elder-friendly foods, the standard was set that it is appropriate to have a viscosity of 1,500 mPa.s or less for drinks for the elderly.