
Figures & data
Figure 1. Normal FTIR spectra of Java Turmeric powders scanned at wavenumbers of 4000–650 cm−1 using attenuated total reflectance (ATR) mode.
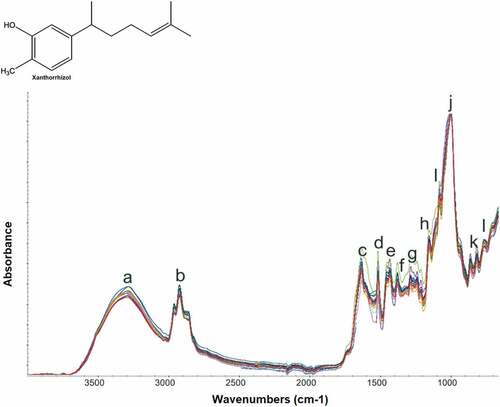
Table 1. The antioxidant activities, phenolics contents and flavonoid contents of Indonesian Curcuma xanthorrhiza powders.
Figure 2. The plot for the correlation of actual values of antioxidant activities and FTIR predicted values assisted by partial least square (PLS) regression [A] along with the loading plot of each variable [B].
![Figure 2. The plot for the correlation of actual values of antioxidant activities and FTIR predicted values assisted by partial least square (PLS) regression [A] along with the loading plot of each variable [B].](/cms/asset/22ecf91f-7830-42ef-8c48-b47604e7cd5b/ljfp_a_2134418_f0002_oc.jpg)
Figure 3. The correlation of actual values of phenolics and flavonoids with FTIR predicted values (calculated responses) assisted by partial least square regression (PLSR) using variables of 97 absorbance values. [A] = phenolics; [B] flavonoid.
![Figure 3. The correlation of actual values of phenolics and flavonoids with FTIR predicted values (calculated responses) assisted by partial least square regression (PLSR) using variables of 97 absorbance values. [A] = phenolics; [B] flavonoid.](/cms/asset/0e3fb007-528e-4474-9350-db9fe20fcb6d/ljfp_a_2134418_f0003_oc.jpg)