
Figures & data
Table 1. Levels of response surface design.
Table 2. Response experimental results of enzyme activity.
Table 3. Regression models and ANOVA results.
Figure 1. Predicted values versus actual values of POD enzyme activity.
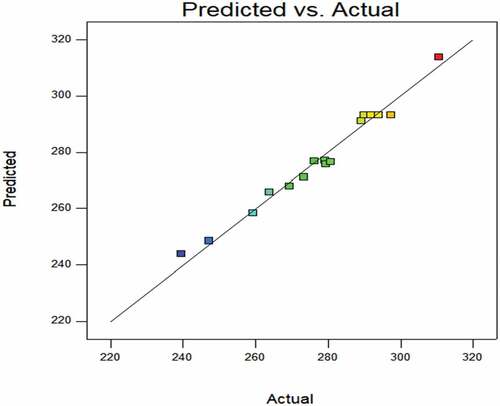
Figure 2. Response surface of the independent variables on POD enzyme activity.
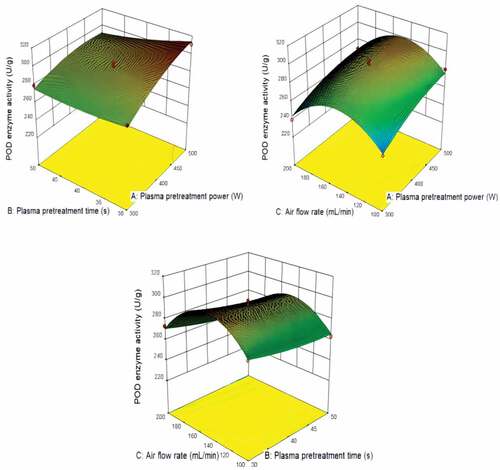
Figure 3. Predicted values versus actual values of CAT enzyme activity.
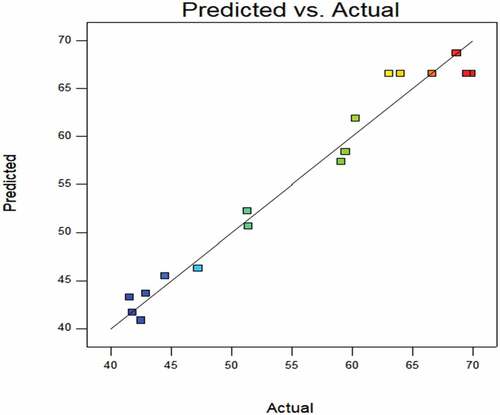
Figure 4. Response surface of the independent variables on CAT enzyme activity.
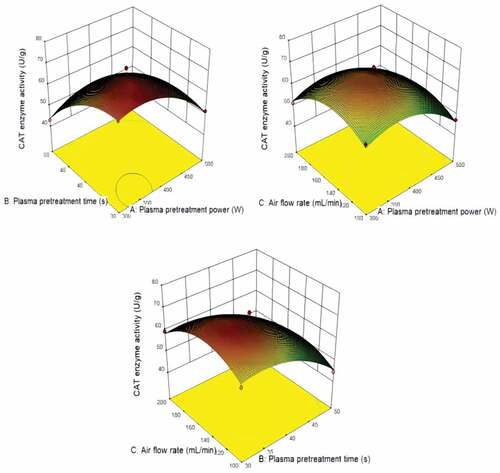
Figure 5. Predicted values versus actual values of SOD enzyme activity.
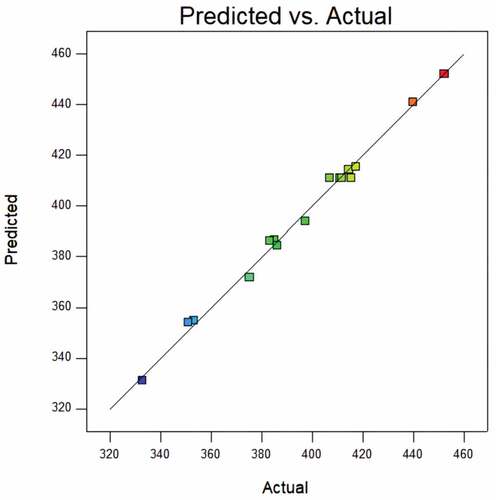
Figure 6. Response surface of the independent variables on SOD enzyme activity.
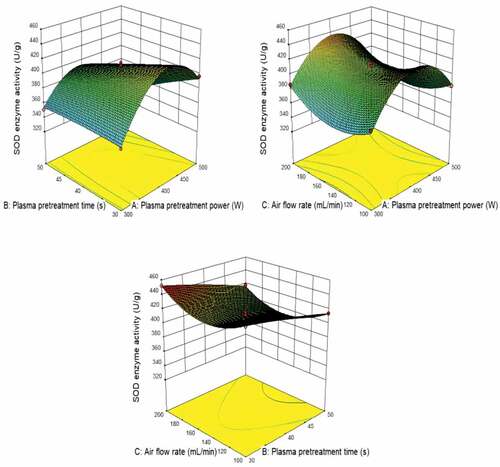
Table 4. Optimal combination verification test of POD enzyme activity.
Table 5. Optimal combination verification test of CAT enzyme activity.
Table 6. Optimal combination verification test of SOD enzyme activity.