Figures & data
Table 1. Local Guava Varieties Cultivar in Pakistan.
Figure 1. Proposed Methodology of Guava Leaf Discrimination by Classification.
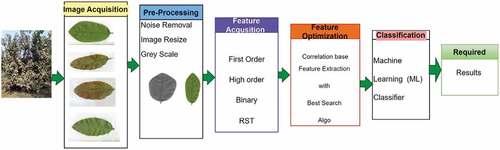
Table 2. Hybrid Threshold Range-Based Segmentation (HTRS).
Table 3. Correlation-based Feature Selection (CFS) List.
Table 4. Training and Testing Data Distribution for Experiments.
Table 5. Machine Learning Classifier Performance on Guava Leaves Images of Size (256 × 256).
Figure 2. Machine Learning Classifier Performance on Guava Leaves Images of Size (256 × 256).
Figure 3. Confusion Matrix Graph of IBI Classifier on Leaves Image Size (256 × 256).
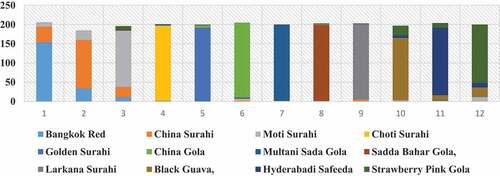
Table 6. Confusion Matrix Table of IBI Classifier on Leaves Image Size (256 × 256).
Table 7. Machine Learning Classifier Performance on Guava Leaves Images of Size (512 × 512).
Figure 4. Confusion Matrix Graph of IBI Classifier on Leaves Image Size (512 × 512).
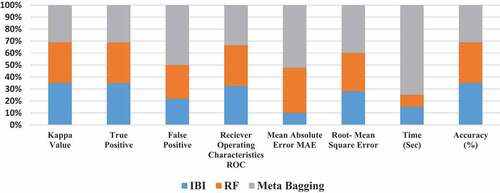
Figure 5. Confusion Matrix Graph of IBI Classifier on Image Size (512 × 512).
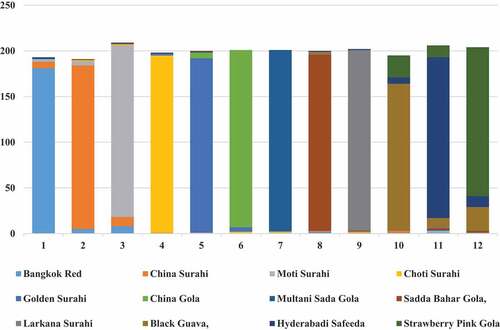
Table 8. Confusion Matrix Table for IBI classifier on Image Size (512 × 512).
Table 9. Comparison of Proposed Approaches with Existing Approaches Working on Leaf Dataset.
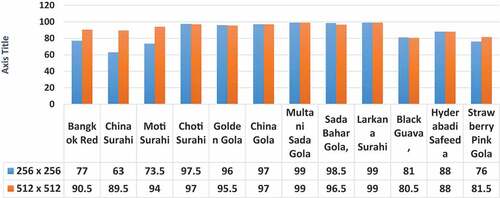
Figure 6. The Comparison Analysis Graph, on Twelve Varieties of Guava Leaves Images between (256 × 256) and (512 × 512).