Figures & data
Table 1. Chocolate biscuits incorporated with encapsulated mangosteen peel extract in different formulations.
Figure 1. Typical instrument texture profile analysis (TPA) graph (Modified image from Liu et al.[Citation21]
![Figure 1. Typical instrument texture profile analysis (TPA) graph (Modified image from Liu et al.[Citation21]](/cms/asset/7d7dd921-438f-437b-a18d-8364c455559c/ljfp_a_2159429_f0001_oc.jpg)
Table 2. The total polyphenol content of chocolate biscuits incorporated with encapsulated mangosteen peel extract in different formulations.
Table 3. Total flavonoid content of chocolate biscuits incorporated with encapsulated mangosteen peel extract in different formulations.
Figure 2. Thermal degradation mechanism of anthocyanins.[Citation43]
![Figure 2. Thermal degradation mechanism of anthocyanins.[Citation43]](/cms/asset/a0dcbd23-cd5b-412d-88e6-e05310149faa/ljfp_a_2159429_f0002_oc.jpg)
Table 4. Antioxidant activity of chocolate biscuits incorporated with encapsulated mangosteen peel extract in different formulations.
Figure 3. Peroxide value of chocolate biscuits incorporated with encapsulated mangosteen peel extract in different formulations during storage.
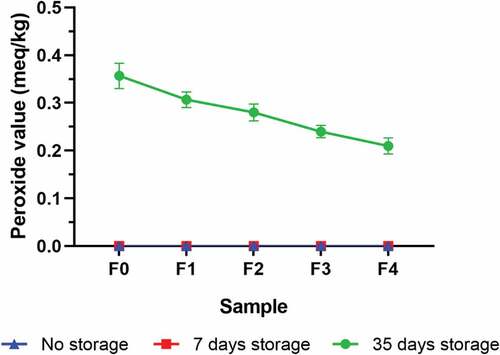
Table 5. Texture profile characteristic of chocolate biscuits incorporated with encapsulated mangosteen peel extract in different formulations.
Table 6. Color analysis of chocolate biscuits incorporated with encapsulated mangosteen peel extract in different formulations.
Figure 4. The physical appearance of chocolate biscuits incorporated with encapsulated mangosteen peel extract in different formulations in the study.
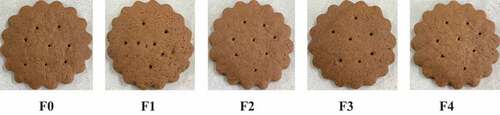
Figure 5. Spider web graph of sensory attributes of chocolate biscuits incorporated with encapsulated mangosteen peel extract in different formulations.
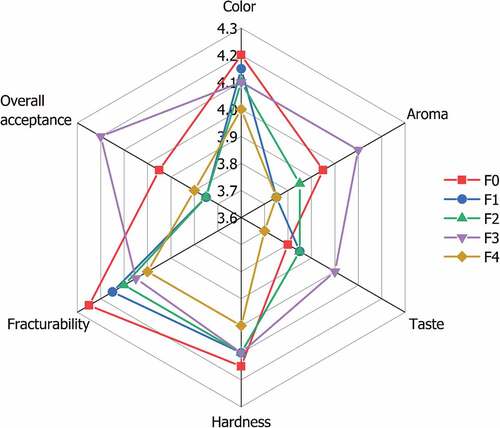
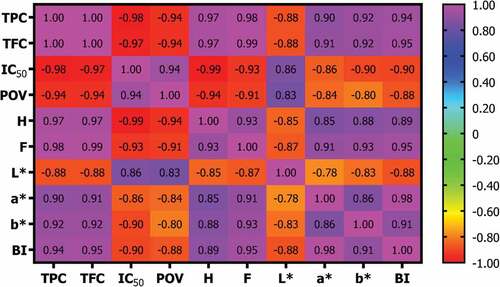
Figure 6. The Pearson correlation coefficient (r) between variables. TPC (total polyphenol content); TFC (total flavonoid content); IC50 (antioxidant activity); POV (peroxide value); H (hardness); F (fracturability); L* (lightness); a* (redness); b* (yellowness); BI (browning index). The correlation is statistically significant at p < .05.