Figures & data
Figure 1. Comparison of prokaryotic microorganism cell growth measured as optical density (OD) in control medium (C) and plasma water-based medium (PL): A – Escherichia coli, B – Staphylococcus aureus, C – Enterococcus faecalis, D – Klebsiella pneumoniae. The tests were carried out in triplicates and averaged. Standard errors were below 5%.
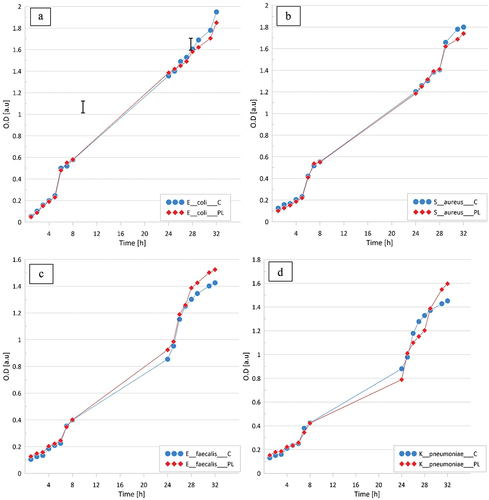
Table 1. Comparison of growth of M. tuberculosis strains in the presence and absence of LPGPA in the culture mediuma,b
Figure 2. Comparison of eukaryotic cell growth measured as optical density (OD) in control medium (C) and plasma water-based medium (PL). A – Saccharomyces cerevisiae, B – Candida albicans, C – Yarrowia lipolytica, D – Aspergillus niger. The tests were carried out in triplicates and averaged. Standard errors were below 5%.
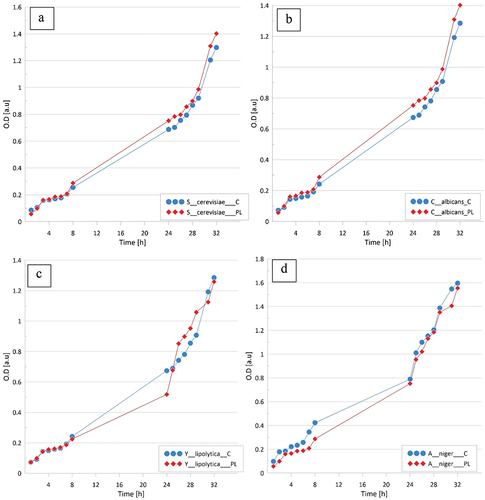
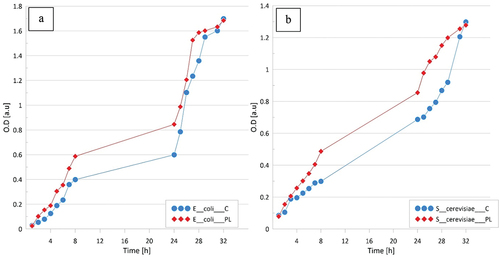
Figure 3. Comparison of cell growth in control medium (C) and plasma water-based minimal medium (PL). A – Escherichia coli, B – Saccharomyces cerevisiae. The tests were carried out in triplicates and averaged. Standard errors were below 5%.