2,001
Views
0
CrossRef citations to date
0
Altmetric
Original Article

Characteristics of propolis encapsulated with gelatin and sodium alginate by complex coacervation method

, , &
Pages 696-707 | Received 11 Oct 2022, Accepted 20 Jan 2023, Published online: 22 Feb 2023

Figures & data

Figure 1. Spray dried yield of propolis microcapsule. Values in the graph followed by different letters were statistically significantly different according to the Analysis of Variance (ANOVA) at Pvalue < 0.05.
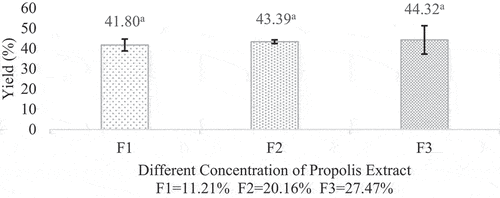
Figure 1. Spray dried yield of propolis microcapsule. Values in the graph followed by different letters were statistically significantly different according to the Analysis of Variance (ANOVA) at Pvalue < 0.05.
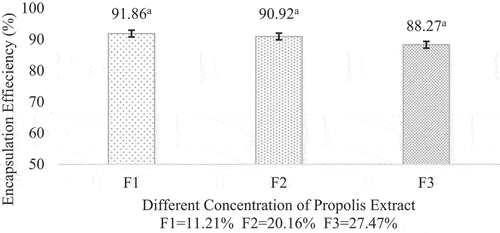
Figure 2. Encapsulation efficiency of propolis microcapsule. Values in the graph followed by different letters were statistically significantly different according to the Analysis of Variance (ANOVA) at Pvalue < 0.05.
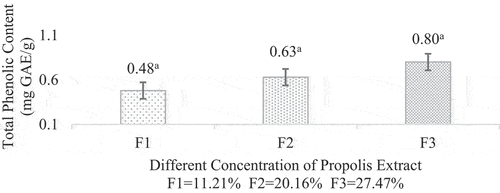
Figure 2. Encapsulation efficiency of propolis microcapsule. Values in the graph followed by different letters were statistically significantly different according to the Analysis of Variance (ANOVA) at Pvalue < 0.05.
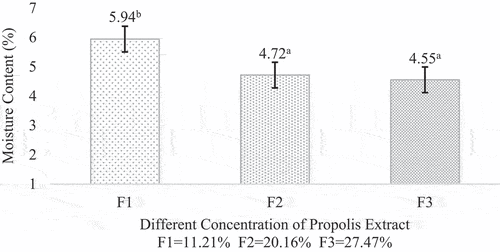
Figure 3. Total phenolic content of propolis microcapsule. Values in the graph followed by different letters were statistically significantly different according to the Analysis of Variance (ANOVA) at Pvalue < 0.05.
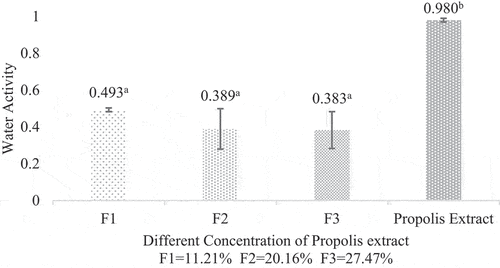
Figure 3. Total phenolic content of propolis microcapsule. Values in the graph followed by different letters were statistically significantly different according to the Analysis of Variance (ANOVA) at Pvalue < 0.05.
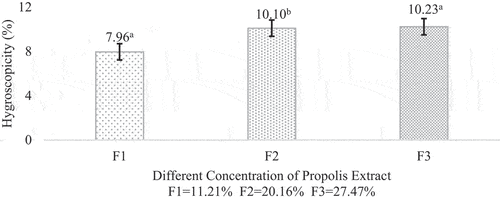
Figure 4. The moisture content of propolis microcapsule. Values in the graph followed by different letters were statistically significantly different according to the Analysis of Variance (ANOVA) at Pvalue < 0.05.
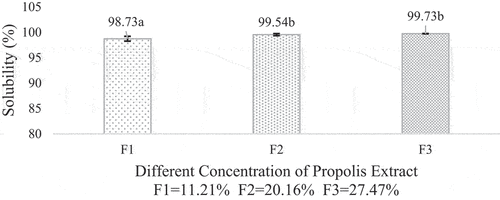
Figure 4. The moisture content of propolis microcapsule. Values in the graph followed by different letters were statistically significantly different according to the Analysis of Variance (ANOVA) at Pvalue < 0.05.

Figure 5. The water activity of propolis microcapsule. Values in the graph followed by different letters were statistically significantly different according to the Analysis of Variance (ANOVA) at Pvalue < 0.05.

Figure 5. The water activity of propolis microcapsule. Values in the graph followed by different letters were statistically significantly different according to the Analysis of Variance (ANOVA) at Pvalue < 0.05.

Figure 6. Hygroscopicity of propolis microcapsule. Values in the graph followed by different letters were statistically significantly different according to the Analysis of Variance (ANOVA) at Pvalue < 0.05.

Figure 6. Hygroscopicity of propolis microcapsule. Values in the graph followed by different letters were statistically significantly different according to the Analysis of Variance (ANOVA) at Pvalue < 0.05.

Figure 7. Solubility of propolis microcapsule. Values in the graph followed by different letters were statistically significantly different according to the Analysis of Variance (ANOVA) at Pvalue < 0.05.

Figure 7. Solubility of propolis microcapsule. Values in the graph followed by different letters were statistically significantly different according to the Analysis of Variance (ANOVA) at Pvalue < 0.05.

Figure 8. Microcapsule morphology as seen in the scanning electron microscope: (a) 5 ml of propolis, (b) 10 ml of propolis, (c) 15 ml of propolis. The accelerating voltages used in SEM image analysis of biological material vary between 5 and 20 kV.
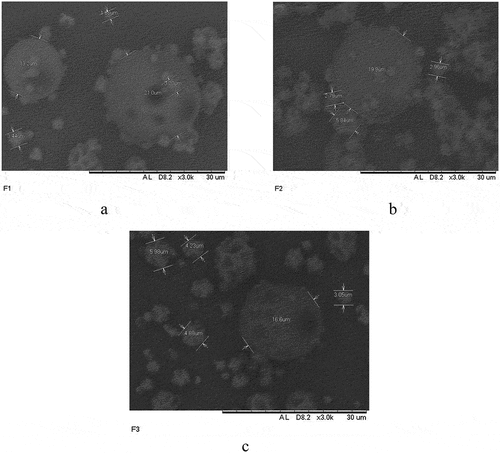
Figure 8. Microcapsule morphology as seen in the scanning electron microscope: (a) 5 ml of propolis, (b) 10 ml of propolis, (c) 15 ml of propolis. The accelerating voltages used in SEM image analysis of biological material vary between 5 and 20 kV.

Figure 9. Dissolution time of propolis microcapsule. Values in the graph followed by different letters were statistically significantly different according to the Analysis of Variance (ANOVA) at Pvalue < 0.05.
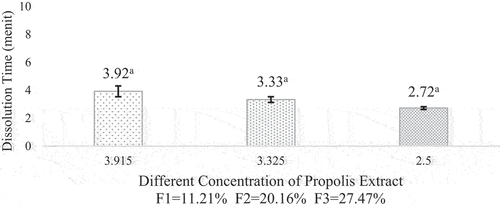
Figure 9. Dissolution time of propolis microcapsule. Values in the graph followed by different letters were statistically significantly different according to the Analysis of Variance (ANOVA) at Pvalue < 0.05.

Table 1. Zeta potential of propolis microcapsule and gelatine solution.