Figures & data
Figure 1. Sample for testing tensile and shear mechanical properties experiments.
Table 1. Factors and levels of tensile and shear mechanical properties experiments.
Figure 2. Self-made shear clamp in the shear test.
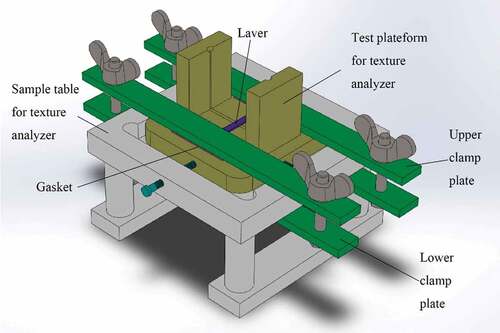
Figure 3. Results of tensile mechanical properties. (a) The load–displacement curve of the tensile test of laver; (b) Macroscopic view of fracture sites of laver samples under tensile test; (c) Effect of loading rate on tensile force; (d) Effect of loading rate on tensile energy; (e) Effect of harvest time on tensile force; (f) Effect of harvest time on tensile energy; (g) Effect of origin on tensile force; (h) Effect of origin on tensile energy. The different uppercase and lowercase letters indicate a significant difference between group (p < 0.05), while same uppercase and lowercase letters indicate no significant difference between group (p > 0.05).
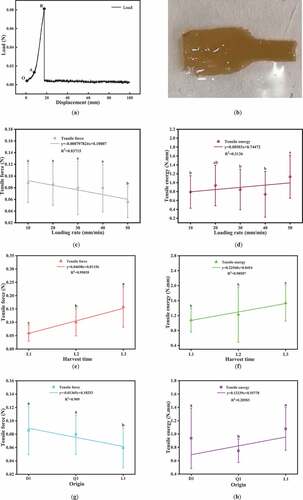
Figure 4. Results of shear mechanical properties. (a) The load–displacement curve of the shear test of laver; (b) Macroscopic view of fracture sites of laver samples under shear test; (c) Effect of loading rate on shear force; (d) Effect of loading rate on shear energy; (e) Effect of harvest time on shear force; (f) Effect of harvest time on shear energy; (g) Effect of origin on shear force; (h) Effect of origin on shear energy. The different uppercase and lowercase letters indicate a significant difference between group (p < 0.05), while same uppercase and lowercase letters indicate no significant difference between group (p > 0.05).
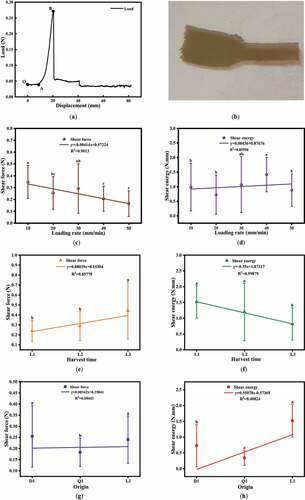
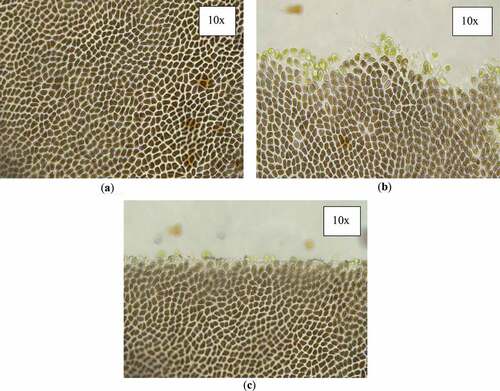
Figure 5. Microscopic views of laver samples. (a) Microscopic view of normal laver cells; (b) Microscopic view of fracture sites of laver samples under tensile test; (c) Microscopic view of fracture sites of laver samples under shear test.