Figures & data
Figure 1. Schematic diagram of the acquisition device. 1- Camera, 2- Freshwater, 3- Conveyor Belt.
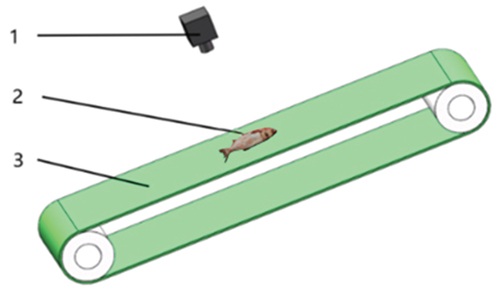
Figure 2. Four fish images. (a) silver carp. (b) Carp. (c) Perch. (d) Bighead carp.
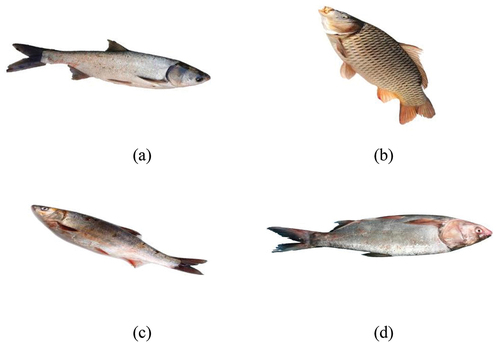
Table 1. Category and quantity of Freshwater fish datasets.
Figure 3. Structure diagram of YOLOV3.
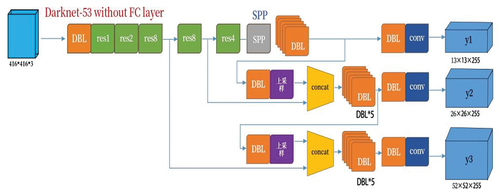
Figure 4. Flow chart of fish head and fish tail detection.
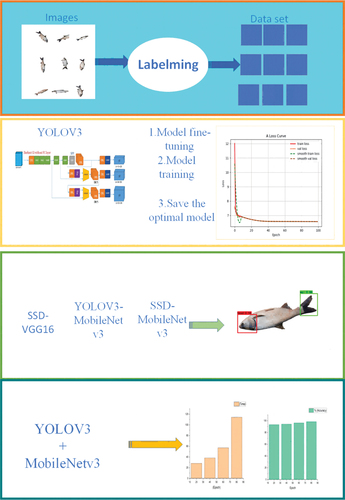
Table 2. Parameters related to the experimental environment.
Figure 5. YOLOV3-Darknet53 detection effect.
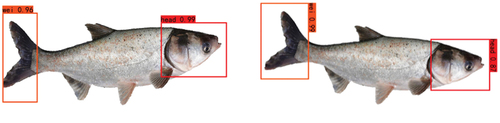
Table 3. Comparison table of detection accuracy and time of the four models.
Figure 6. The loss curve of the freshwater fish dataset. (1) SSD-VGG16; (2) SSD-MobileNetV3.
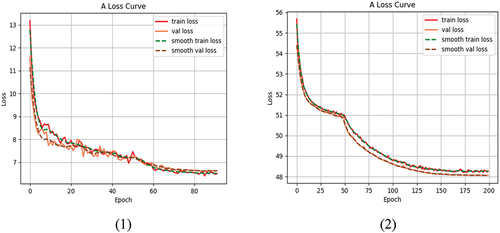
Figure 7. The actual test result for the freshwater fish dataset. (a) The test results of YOLOv3-MobileNetv3. (b) The test results of SSD-MobileNetv3. (c) The test results of SSD-VGG16.
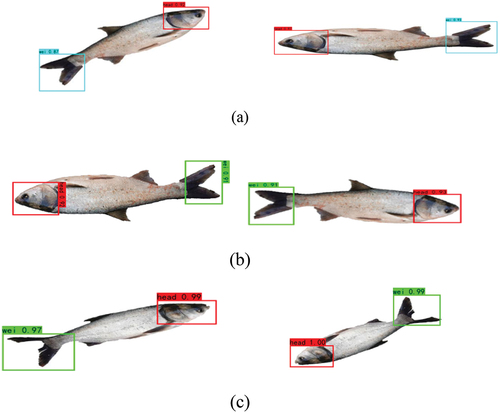
Figure 8. The loss curve of the freshwater fish dataset. (1) YOLOV3-Darknet-53; (2) YOLOV3-MobileNetV3.
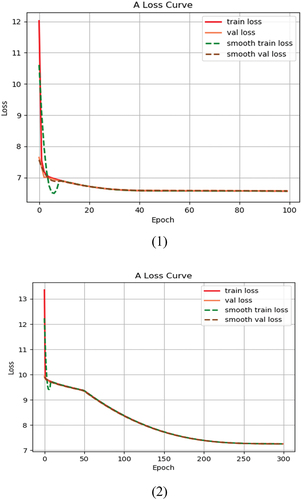
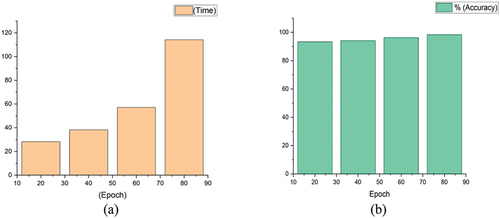
Figure 9. The comparison of four deep learning-based target detection models. (a) Time comparison. (b) Accuracy comparison.